Acoustic Recorders Miss Most Wildlife Sounds When Facing the Wrong Way
New field experiments reveal that hardware placement and sound frequency can drastically limit the reach of automated wildlife monitoring devices.
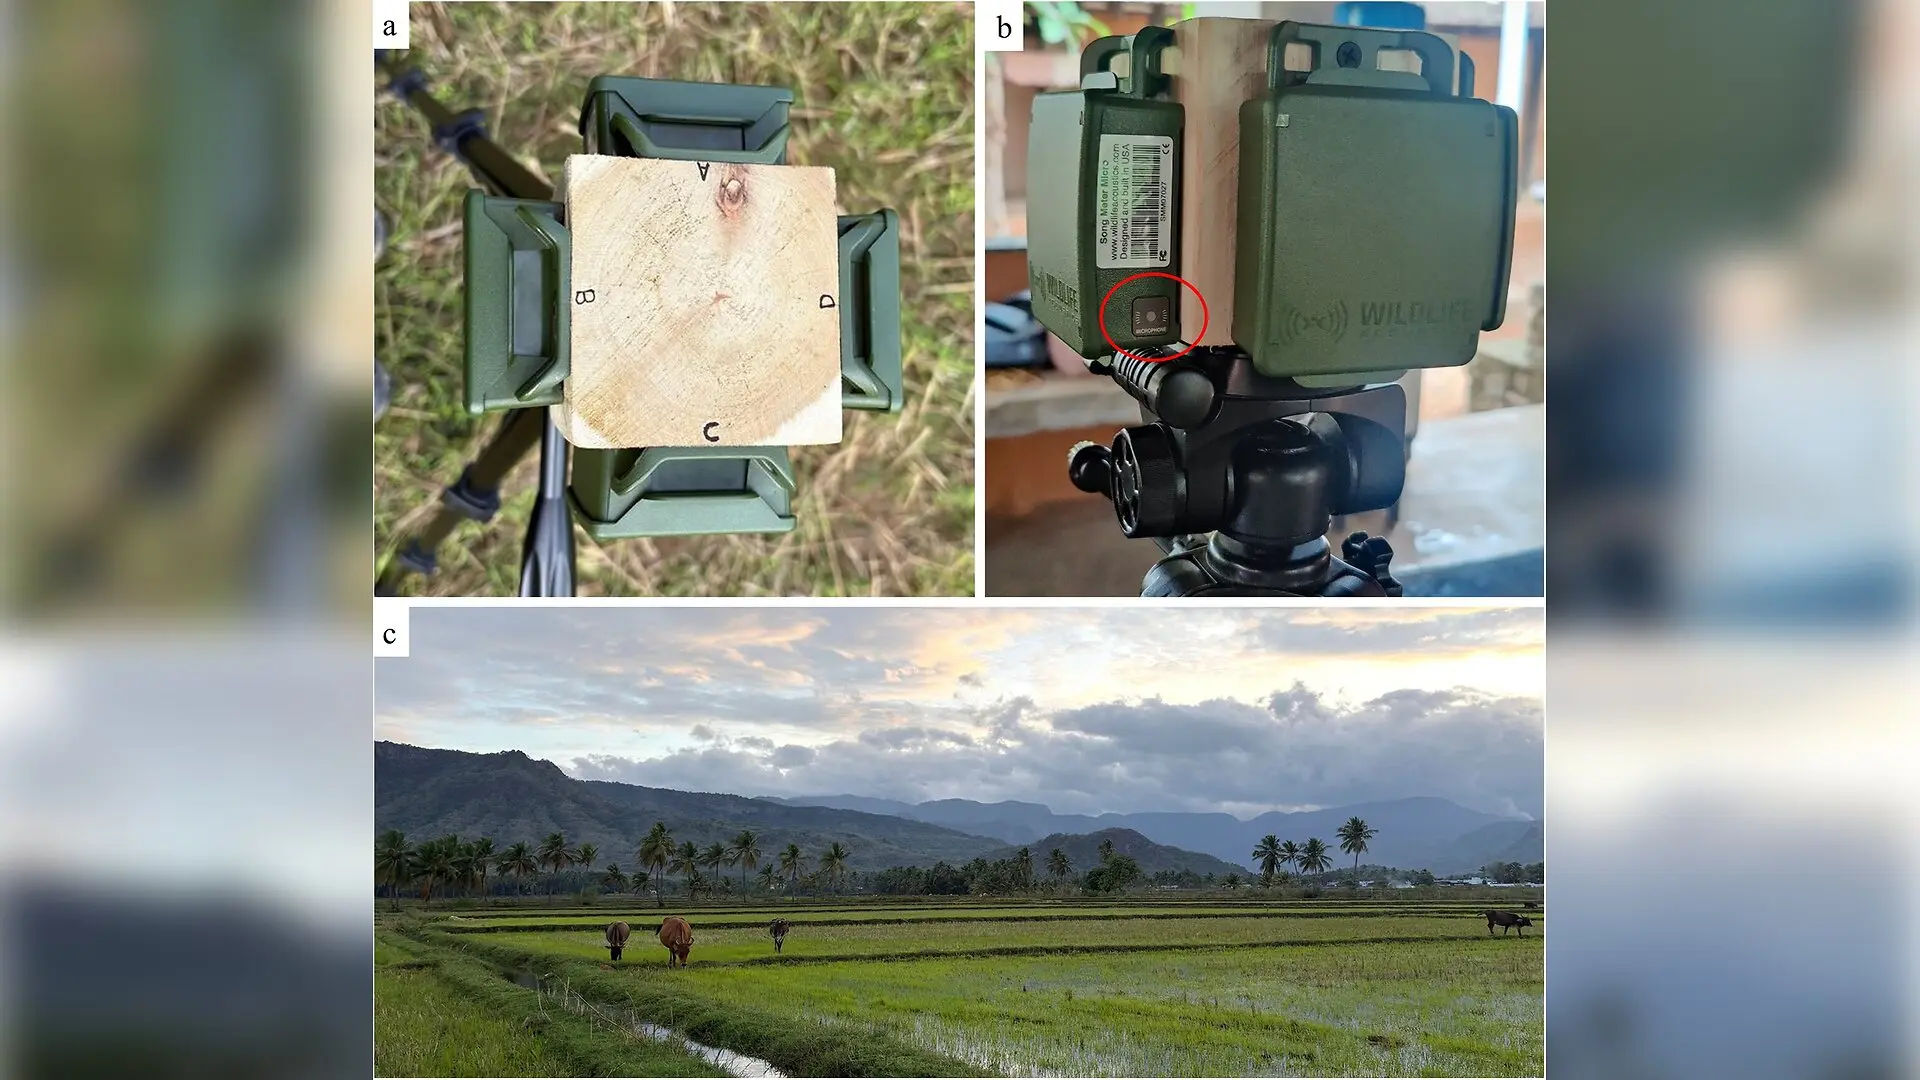
Acoustic recorders placed in farm fields to monitor wildlife can lose up to 86 percent of their detection capacity when facing the wrong direction, according to a recent field experiment. Scientists measuring sound propagation found that small automated devices frequently fail to capture animal vocalizations uniformly, challenging long-held assumptions about their acoustic coverage.
How Hardware Orientation Creates Hidden Acoustic Shadows
Automated recording devices are increasingly deployed across agricultural and natural landscapes to track biodiversity without human observers present. These devices typically feature built-in omnidirectional microphones designed to capture sounds evenly from all directions. To test whether this holds true in real-world conditions, researchers conducted controlled sound playback experiments in fallow rice paddy fields in the Western Ghats region of India.
The study, published in PLOS One by Prabhat Sharma and colleagues, evaluated how sound frequency, distance, humidity, and recorder placement interact to alter signal detection. The authors broadcast standardized pure tone signals ranging from 1 to 8 kilohertz over distances spanning 50 to 300 meters using four synchronized recording units mounted in a fixed square configuration.
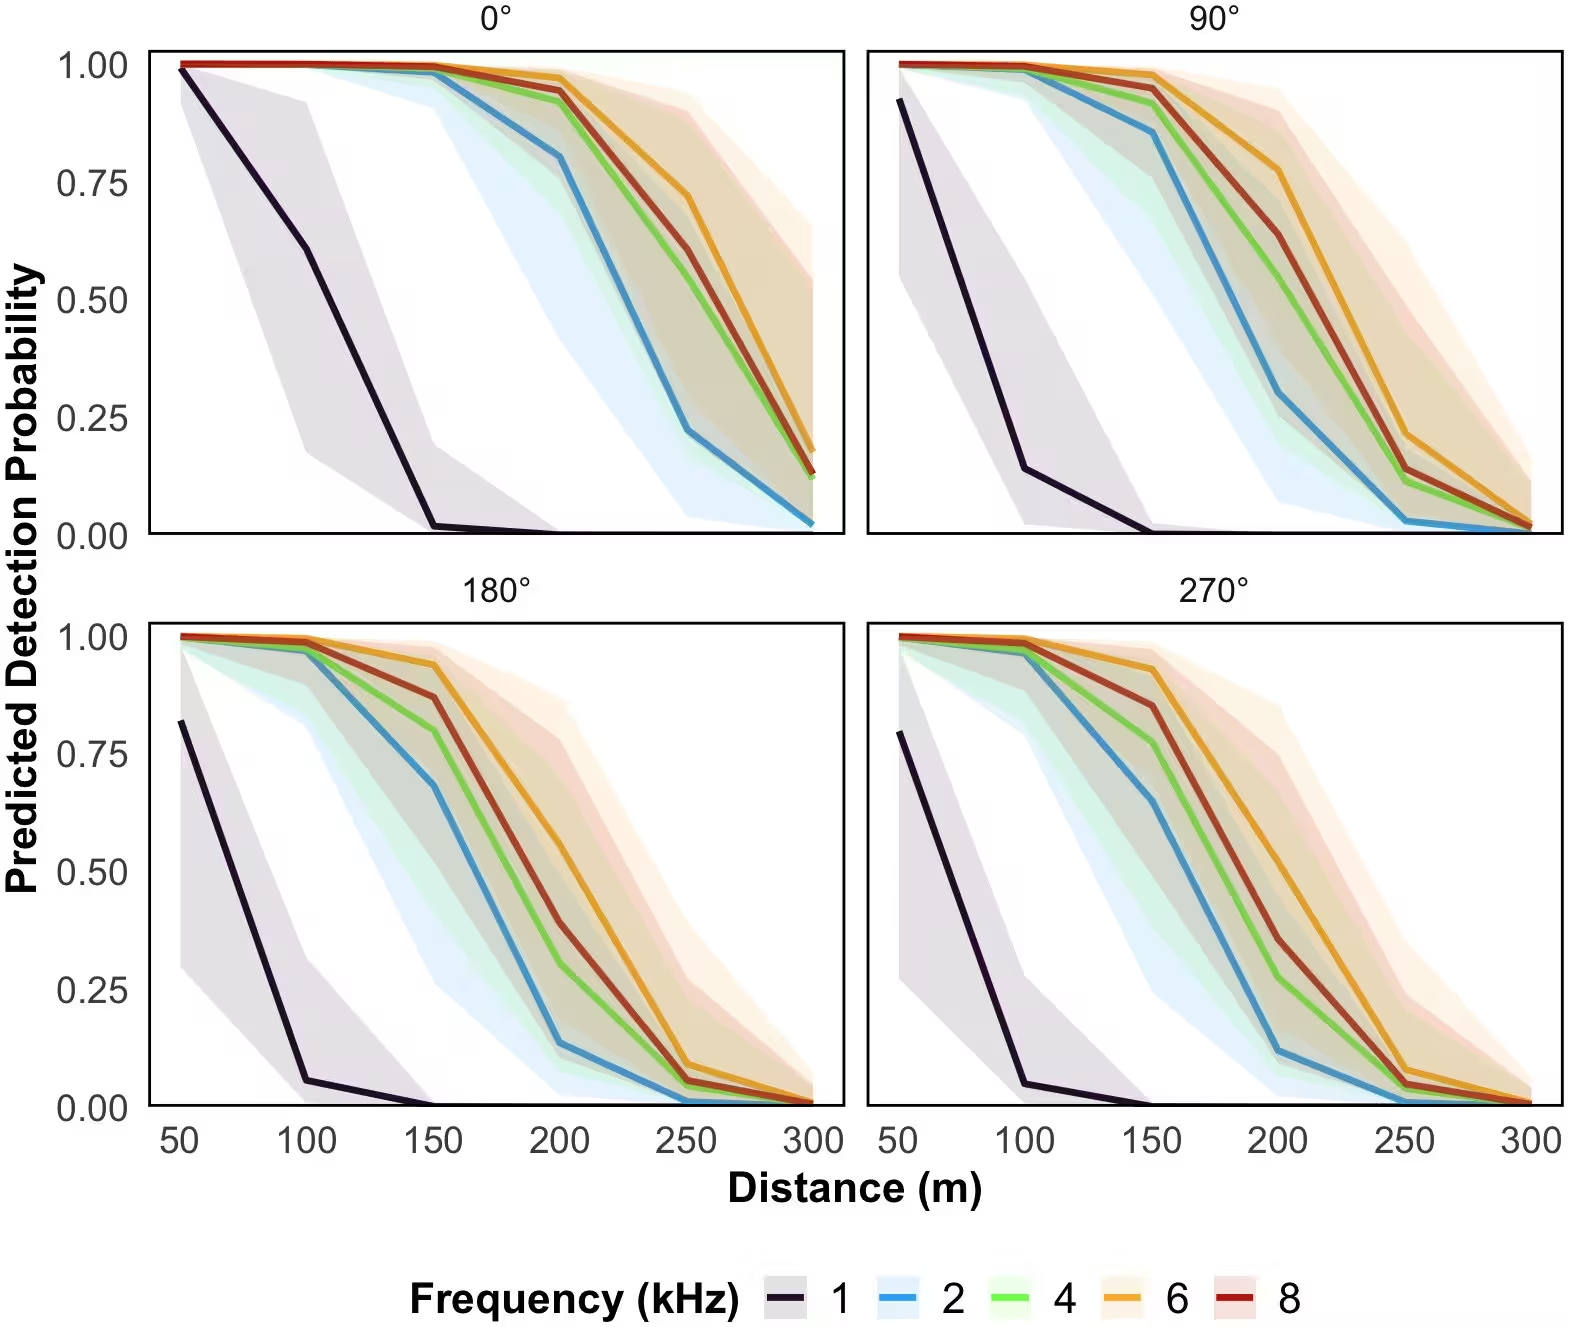
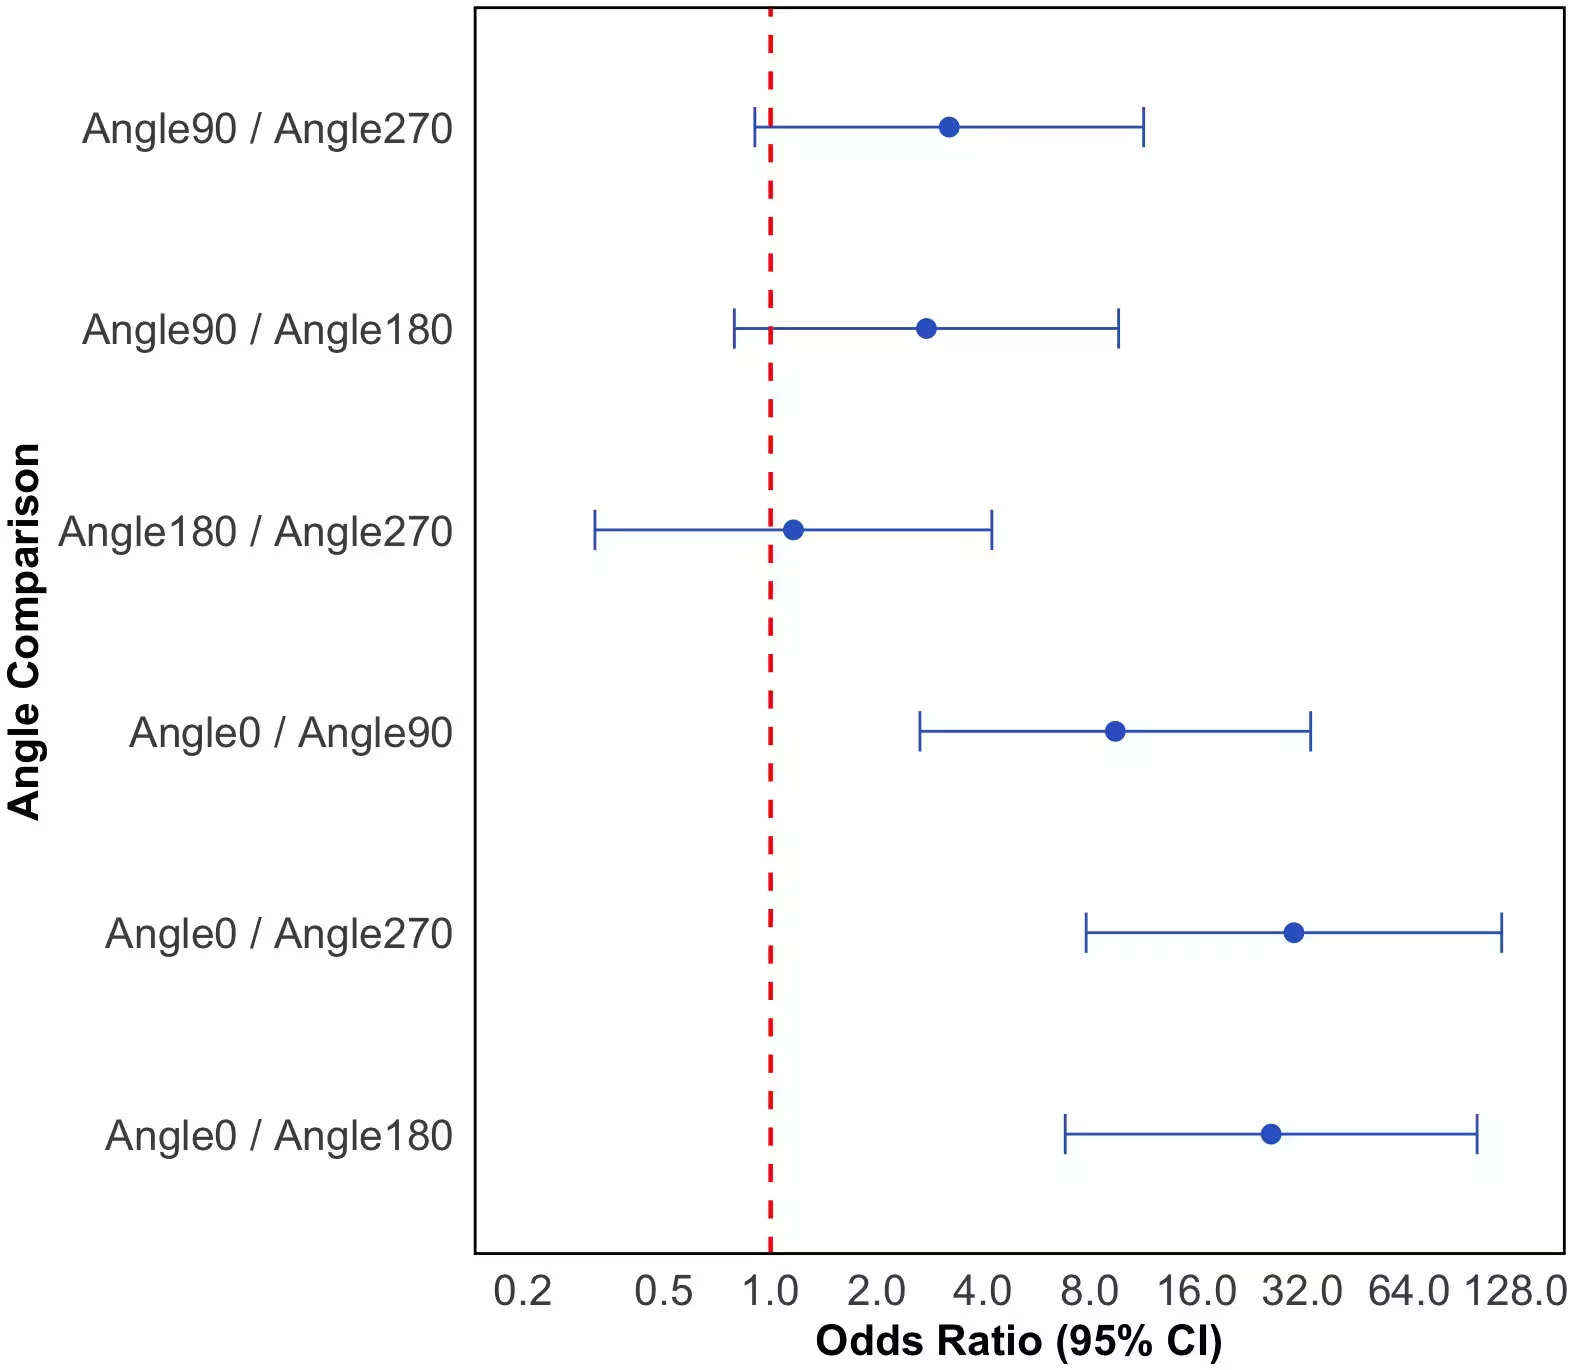
When the recording units faced directly toward the sound source, they achieved an 81 percent detection probability. However, when the units faced away from the source at a 180-degree angle, detection plummeted to just 14 percent. Lateral placements at 90 and 270 degrees also suffered steep drop-offs, yielding detection probabilities of 31 percent and 12 percent respectively. The data indicate that the physical housing of the device and its mounting structure create a significant acoustic shadow, rendering omnidirectionality more of a theoretical maximum than a field reality.
Why Mid-Frequency Sounds Travel Further Than Low-Pitch Calls
Sound propagation was also heavily influenced by signal frequency and environmental conditions. Low-frequency signals at 1 kilohertz experienced a rapid decline in detectability, with a 50 percent detection threshold occurring at roughly 100 meters. This rapid fading is attributed to ground effects, where sound waves interacting with the soft surface of fallow fields interfere destructively with direct waves.
In contrast, mid-range signals between 4 and 6 kilohertz exhibited the highest resilience, remaining reliably detectable up to 250 meters. Higher frequencies at 8 kilohertz showed increased atmospheric attenuation, reducing their effective range compared to the mid-frequency window. Environmental factors further modulated these patterns, with higher relative humidity significantly enhancing signal detection across the spectrum.
What These Blind Spots Mean for Global Conservation Efforts
The authors warn that failing to account for these detection limits can severely skew ecological assessments. In fragmented landscapes, uncalibrated recorders in restoration plots might accidentally eavesdrop on vocalizing wildlife in adjacent natural forests, leading researchers to overestimate the success of conservation interventions. To mitigate these errors, the team proposed a five-stage decision support framework that helps practitioners factor in target species frequencies, local weather conditions, and hardware orientation before launching large-scale acoustic monitoring programs.
The research was published in PLOS One on October 27, 2026.
This article has been fact checked for accuracy, with information verified against reputable sources. Learn more about us and our editorial process.
Last reviewed on .
Article history
- Latest version
Reference(s)
- Sharma, Prabhat., et al. “Sound advice: A calibration framework for defining detection space in passive acoustic monitoring.” PLOS One, vol. 21, no. 10, October 27, 2026, pp. e0350789 Public Library of Science (PLoS), doi: 10.1371/journal.pone.0350789. <https://doi.org/10.1371/journal.pone.0350789>.
Cite this page:
- Posted by Omar Mirza