New Math Formula Bypasses High-Dimensional Data Trap
A novel additive regression framework for complex metric spaces achieves univariate convergence rates without flattening data.

A new mathematical framework allows scientists to model complex, multi-dimensional data without getting trapped by a mathematical roadblock known as the curse of dimensionality. Researchers developed a technique called additive Fréchet regression to analyze complex objects like brain networks and probability distributions, and the study is available on the arXiv preprint server.
How Do Mathematicians Analyze Objects Without Numbers?
In standard statistics, data usually consists of numbers or vectors that live in flat spaces where addition and multiplication work normally. But modern science deals with abstract items, such as entire networks, shapes, or probability curves, which live in general metric spaces. A metric space is a mathematical setting where you can measure the distance between two objects, but you cannot necessarily add them together or scale them like regular numbers.
When researchers want to study how a set of standard predictor variables affects these complex object responses, they often use Fréchet regression. While flexible, traditional local regression models struggle immensely when the number of predictor variables grows larger. This performance breakdown happens because the data points scatter too thinly across high-dimensional spaces, making reliable estimates nearly impossible to compute.
What Makes the New Additive Approach Different?
To solve this hurdle, the authors introduced an intrinsic additive structure for non-Euclidean data. Instead of forcing complex objects to flatten into traditional linear spaces through risky transformations, the team built a method that operates directly inside the original metric space. By leveraging projection operators and a smoothing technique called smooth backfitting, the new estimator breaks down multivariate relationships into simpler, manageable components.
The authors proved that this additive model achieves standard univariate convergence rates regardless of how many predictor variables are used, provided the number remains fixed. This means the model successfully bypasses the curse of dimensionality while retaining high flexibility. The framework applies broadly to network data represented by graph Laplacians, compositional data, and probability distributions governed by Wasserstein geometry.
How Well Does the Model Perform on Real Data?
To test the practical utility of their mathematical model, the researchers applied it to real-world datasets, including brain connectivity networks from the Alzheimer’s Disease Neuroimaging Initiative and physical activity distributions from the National Health and Nutrition Examination Survey. In both scenarios, the additive Fréchet regression method yielded lower prediction errors and revealed clearer biological insights than older global or local regression techniques.
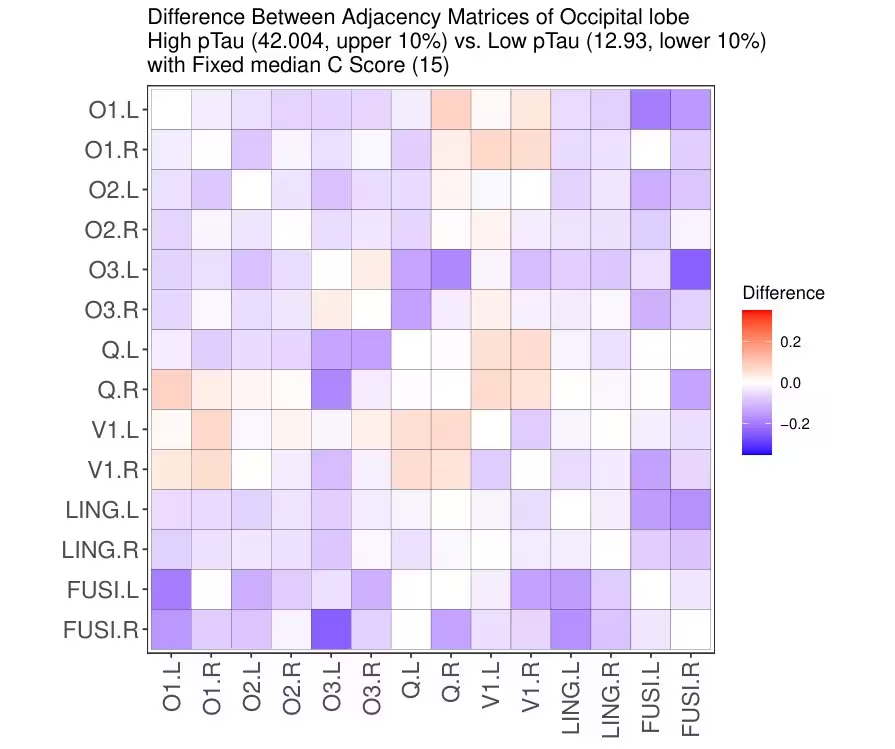
For instance, when examining brain scans, the model highlighted how elevated levels of specific protein biomarkers correlate with reduced functional connectivity in particular regions of the brain. Similarly, the physical activity analysis demonstrated precise trends related to age, body mass index, and diet quality. These tests confirm that abstract mathematical theory can successfully translate into powerful tools for analyzing messy, real-world scientific data.
The study was posted to the arXiv preprint server on November 19, 2026.
This article has been fact checked for accuracy, with information verified against reputable sources. Learn more about us and our editorial process.
Last reviewed on .
Article history
- Latest version
Reference(s)
- Choi, Changwon. “Additive Fréchet Regression for Random Objects.” arXiv.org <http://arxiv.org/abs/2611.26614v1>.
Cite this page:
- Posted by Rabia Shah