Busy Roads Drive Tree Pollen Hotspots More Than Urban Trees
Traffic density explains nearly 40 percent of pollen loading variations across a major UK city, while local tree cover explains less than 5 percent.
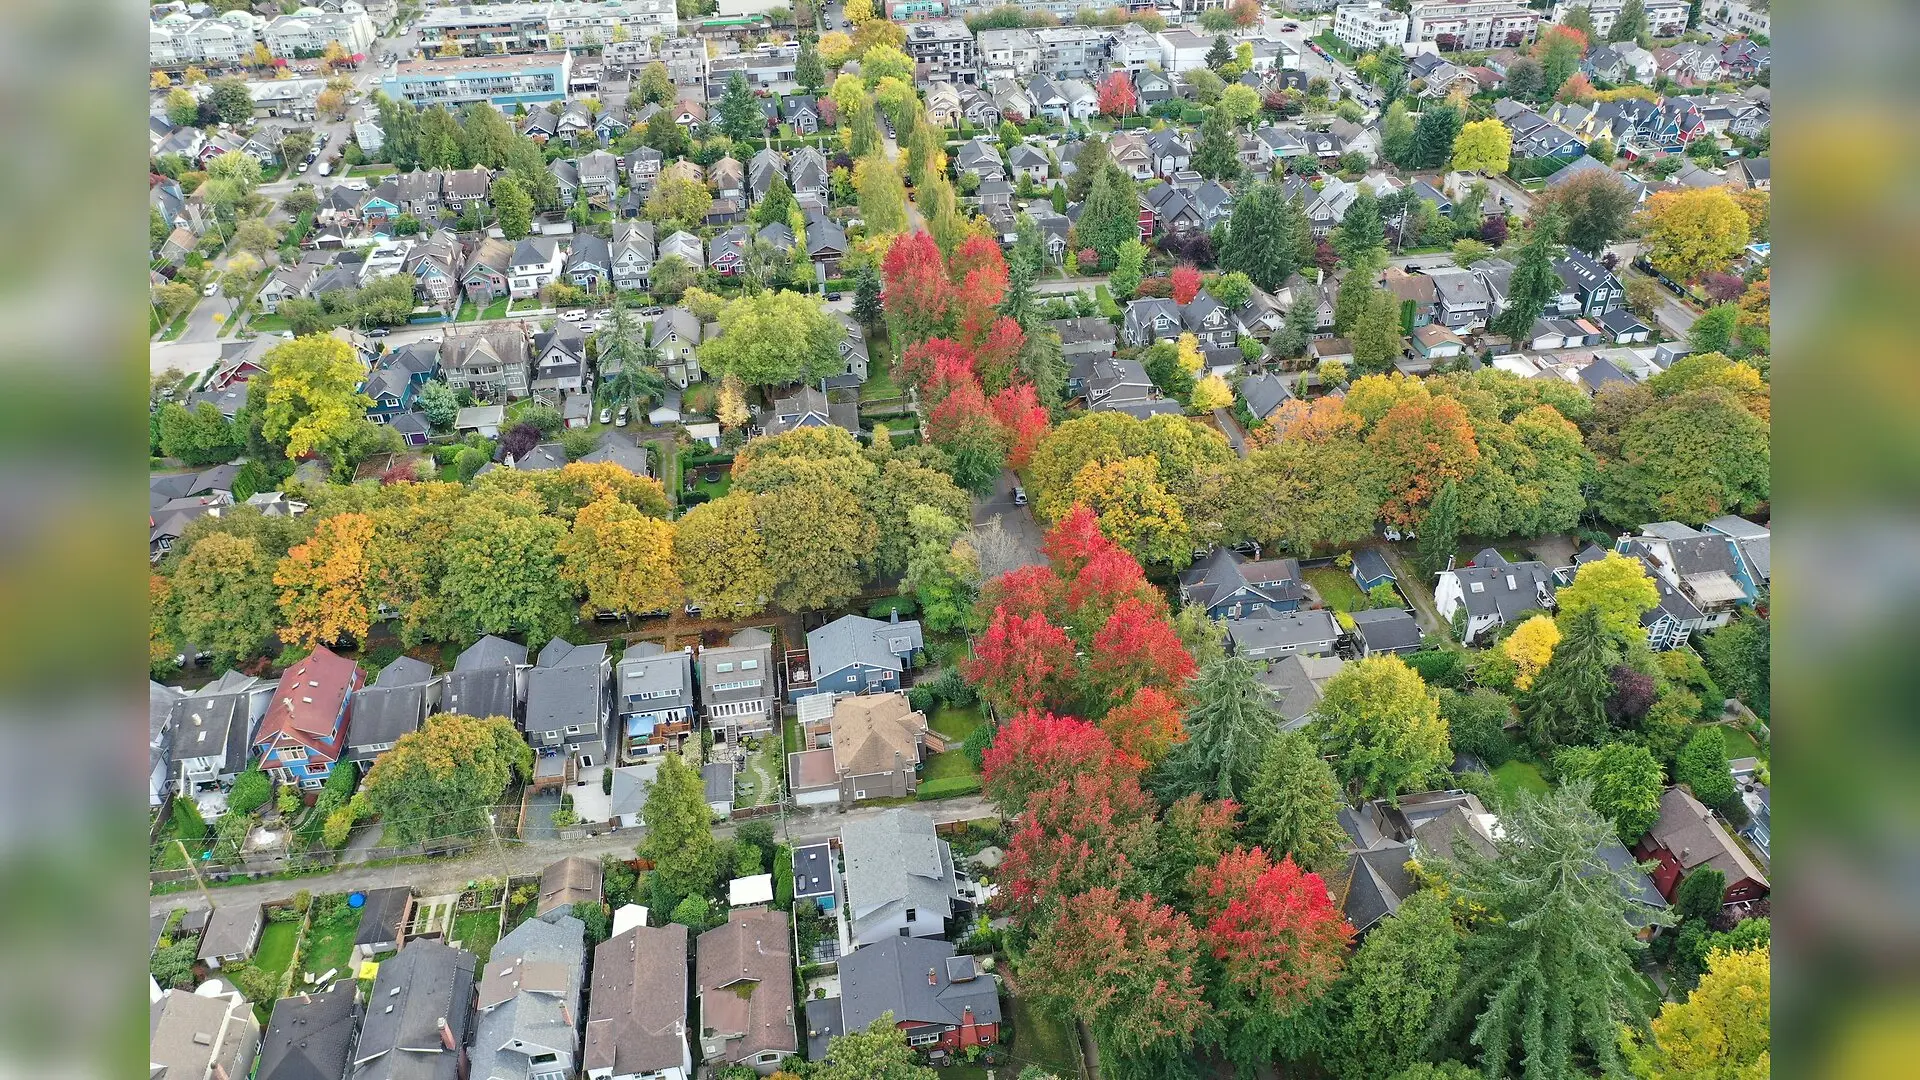
Intense vehicle traffic in urban areas may drive heavy accumulations of airborne tree pollen far more than the actual number of nearby trees. Researchers tracking pollen levels across 37 locations in Nottingham, UK, discovered that busy roadways act as major collection zones for allergenic particles, challenging long-held assumptions about where allergy sufferers face the highest risks.
The study, published in Environmental monitoring and assessment, sheds light on the fine-scale spatial distribution of tree pollen during the early spring season of 2025. Allergic diseases like asthma and rhinitis impact up to 300 million people worldwide, and urban residents often suffer more severe symptoms than rural populations due to the combined pressures of heat islands, air pollution, and altered vegetation.
Surprising Pollen Hotspots Found Away From Green Spaces
To map how pollen moves through a city, the team deployed a dense network of 51 passive pollen traps mounted on lampposts at roughly 2-meter heights across the Nottingham City Council region. These traps, consisting of funnels and cellulose filter tips, collected samples from January 31 through April 24, 2025. Out of the original setups, 37 samples contained enough marker spores to be reliably analyzed for absolute pollen loading.
Microscopic analysis revealed that five primary tree taxa dominated the early spring landscape, accounting for 86 percent of all counted grains. Birch trees topped the list at 30 percent, followed by ash at 15.6 percent, cypress and juniper at 14.9 percent, alder at 13.6 percent, and oak at 11.6 percent.
When the researchers interpolated these counts across the city using spatial modeling, they expected the highest pollen loads to cluster directly around large public parks and woodlands, such as Wollaton Park and the Arboretum, where tree density is highest. Instead, the highest pollen loadings appeared in the southern and south-western industrial and commercial sectors of the city, regions with relatively limited tree cover but exceptionally heavy traffic.
How Vehicle Emissions and Wind Shape Allergy Risk
Statistical evaluations revealed a strong positive correlation between traffic intensity and local pollen loadings, yielding a Pearson correlation coefficient of 0.681. In contrast, the volume of council-managed tree crowns showed a much weaker relationship with pollen presence, with a correlation coefficient of just 0.330.
Variance partitioning analysis demonstrated that traffic data uniquely accounted for nearly 40 percent of the variation in pollen loading across the grid cells, while local tree crown volume explained only 4.4 percent. The authors suggest several physical and chemical mechanisms behind this heavy traffic coupling. Moving vehicles create air turbulence and wake vortices that resuspend fallen pollen from the ground, keeping it circulating at street level. Furthermore, exhaust pollutants such as particulate matter can bind to pollen grains, increasing their mass and causing them to settle locally rather than dispersing far away.
Limitations and Future Urban Planning Goals
The investigators noted several constraints in their preliminary work, including the fact that passive traps measure relative pollen loading rather than precise volumetric concentrations per cubic meter of air. Additionally, the sampling window closed in late April, meaning late-pollinating species like pine were missed, and low marker counts in some samples introduced a degree of statistical uncertainty.
Despite these caveats, the findings suggest that urban planners should look beyond simply planting or removing trees when trying to mitigate public health risks. Because major transport corridors can concentrate and redistribute allergenic grains, managing traffic flow and reducing vehicular emissions may prove just as vital for protecting vulnerable city residents during peak pollination months.
The research was published in Environmental monitoring and assessment on November 18, 2026.
This article has been fact checked for accuracy, with information verified against reputable sources. Learn more about us and our editorial process.
Last reviewed on .
Article history
- Latest version
Reference(s)
- Wills, Alastair., et al. “Mapping urban pollen at high spatial resolution: a preliminary city-wide study in Nottingham, UK.” Environmental Monitoring and Assessment, vol. 198, no. 12, November 18, 2026 Springer Science and Business Media LLC, doi: 10.1007/s10661-026-16153-9. <https://doi.org/10.1007/s10661-026-16153-9>.
Cite this page:
- Posted by William Moore