Displaying items by tag: Diseases and Disorders
Proteinuria: Purpose, Test Procedure and Results
A urine protein test checks the amount of protein in urine. Normally, healthy people don't have much protein in their urine. But if the kidneys aren't working well or if there are high levels of certain proteins in the bloodstream, protein might show up in the urine.
Qualitative Estimation of Proteins
Method 1: Heat and Acetic Acid Test (Boiling Test)
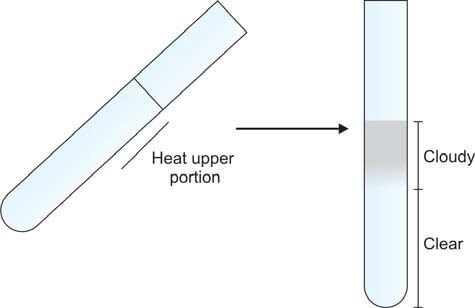
This test operates on the principle that when proteins are heated in an acidic solution, they undergo precipitation.
Method
Ensure clarity in urine; if not, either filter it or utilize the supernatant from a centrifuged sample.
Confirm urine acidity (verify with litmus paper); if not acidic, gradually add 10% acetic acid until the blue litmus paper transitions to red.
Take a test tube and fill it two-thirds with urine. Incline the tube at an angle and heat the upper portion over a flame. (Specifically, only heat the upper portion to avoid disrupting the precipitate with convection currents generated by heat, allowing for a clear comparison between the upper and lower segments). Compare the heated part with the lower part. The presence of cloudiness or turbidity indicates the existence of either phosphates or proteins (refer to Figure 1). Introduce a few drops of 10% acetic acid, then boil the upper portion again. Turbidity originating from phosphates disappears, whereas that arising from proteins persists.
This test may yield a false-positive outcome in the presence of tolbutamide and elevated levels of penicillins.
Method 2: Reagent Strip Test
The reagent section of the strip is covered with an indicator and buffered to an acidic pH, displaying a color change in the presence of proteins (refer to Figures 821.2 and 821.3). This phenomenon is referred to as the "protein error of indicators" principle.
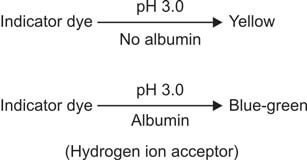
The reagent region is saturated with bromophenol blue indicator buffered to pH 3.0 using citrate. As the dye adheres to proteins, there is a shift in ionization (and consequently, pH) of the indicator, resulting in a color change. The intensity of the produced color is directly proportional to the protein concentration. This test is semi-quantitative in nature.
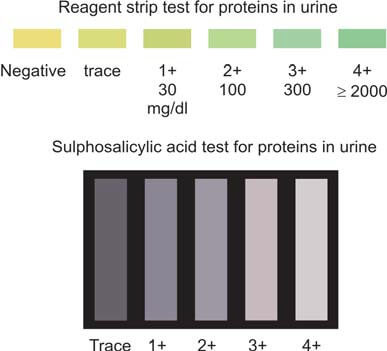
The reagent strip test primarily reacts to albumin but may yield false-negative results in the presence of Bence Jones proteins, myoglobin, and hemoglobin. If solely relying on the reagent strip method, there is a risk of overlooking overload (Bence Jones) proteinuria and tubular proteinuria. To ensure accuracy, it is advisable to follow this test with the sulphosalicylic acid test, which serves as a confirmatory measure. It's important to note that highly alkaline urine, significant hematuria, and contamination with vaginal secretions can potentially cause false-positive reactions in this test.
Method 3: Sulphosalicylic Acid Test
Introduction of sulphosalicylic acid into urine leads to the precipitation of a white substance if proteins are present. Organic acids denature proteins, causing them to precipitate out of the solution.
To perform the test, take 2 ml of clear urine in a test tube. If the urine's pH is neutral or alkaline, introduce a drop of glacial acetic acid. Following this, add 2-3 drops of sulphosalicylic acid (3 to 5%) and observe for turbidity against a dark background (refer to Figure 3). This method proves to be more sensitive and dependable compared to the boiling test.
However, it's crucial to note that false-positive results may arise due to various factors such as gross hematuria, highly concentrated urine, radiographic contrast media, excess uric acid, tolbutamide, sulphonamides, salicylates, and penicillins. On the contrary, a false-negative outcome may occur when dealing with very dilute urine.
This test is proficient in detecting a range of proteins, including albumin, hemoglobin, myoglobin, and Bence Jones proteins. For a comprehensive understanding, Table 1 illustrates a comparison between the reagent strip test and the sulphosalicylic acid test.
| Parameter | Reagent strip test | Sulphosalicylic acid test |
|---|---|---|
| Principle | Colorimetric | Acid precipitation |
| Proteins detected | Albumin | All (albumin, Bence Jones proteins, hemoglobin, myoglobin) |
| Sensitivity | 5-10 mg/dl | 20 mg/dl |
| Indicator | Color change | Turbidity |
| Type of test | Screening | Confirmatory |
Quantitative Estimation of Proteins
The indications for quantifying protein levels in urine encompass several key aspects within the realm of clinical diagnosis and therapeutic monitoring. These include:
- Diagnosis of Nephrotic Syndrome: Determining the presence of nephrotic syndrome stands as a primary motive for conducting quantitative estimations of proteins in urine. This serves as a crucial diagnostic parameter, aiding in the identification and characterization of renal conditions associated with abnormal protein excretion.
- Detection of Microalbuminuria or Early Diabetic Nephropathy: Another pivotal application is the identification of microalbuminuria, a subtle yet significant indication of early-stage diabetic nephropathy. This underscores the proactive role of protein quantification in recognizing incipient renal complications in diabetic patients, facilitating timely intervention.
- Monitoring Response to Therapy in Renal Disease: Quantitative assessment of proteins in urine plays a vital role in monitoring the efficacy of therapeutic interventions in renal diseases. This ongoing evaluation provides valuable insights into the patient's response to treatment, guiding adjustments and refinements in the therapeutic approach as needed.
In the context of proteinuria levels, specific thresholds offer diagnostic distinctions:
- Proteinuria exceeding 1500 mg in a 24-hour period signals the presence of glomerular disease.
- When proteinuria surpasses 3500 mg in 24 hours, it is categorized as nephrotic range proteinuria. Conversely, in tubular, hemodynamic, and post-renal diseases, proteinuria typically falls below 1500 mg in a 24-hour timeframe.
The grading of albuminuria, a subset of proteinuria, is systematically presented in Table 2. This classification aids in stratifying the severity of albumin excretion, providing a standardized framework for clinical interpretation.
Two distinct methodologies are employed for the quantitative assessment of proteins in urine:
- Estimation of Proteins in a 24-hour Urine Sample: This method involves collecting urine over a complete day to analyze the total protein excreted during that period.
- Estimation of Protein/Creatinine Ratio in a Random Urine Sample: An alternative approach involves determining the ratio of protein to creatinine in a random urine sample. This method offers a more immediate assessment, providing valuable information without the need for a full-day urine collection.
| Condition | mg/24 hr | mg/L | mg/g creatinine | μg/min | μg/mg creatinine | g/mol creatinine |
|---|---|---|---|---|---|---|
| Normal | < 30 | < 20 | < 20 | < 20 | < 30 | < 2.5 |
| Microalbuminuria | 30-300 | 20-200 | 20-300 | 20-200 | 30-300 | 2.5-25 |
| Overt albuminuria | > 300 | > 200 | > 300 | > 200 | > 300 | > 25 |
Quantifying Proteins in a 24-Hour Urine Sample: Accurate assessment of protein levels begins with the collection of a 24-hour urine sample, a procedure outlined earlier. The reliability of this sample is ensured by verifying its adequacy through the calculation of the expected 24-hour urine creatinine excretion. The daily output of urinary creatinine, a marker influenced by muscle mass, tends to remain relatively stable within an individual. For adult males, the range of creatinine excretion falls between 14-26 mg/kg/24 hours, while in females, it spans from 11-20 mg/kg/24 hours. Diverse methods are available for the precise quantification of proteins, encompassing Esbach’s albuminometer method, turbidimetric methods, the biuret reaction, and immunologic methods.
Assessing Protein/Creatinine Ratio in a Random Urine Sample: Recognizing the challenges associated with incomplete 24-hour urine collections, many laboratories opt for measuring the protein/creatinine ratio in random urine samples. A normal protein/creatinine ratio is < 0.2. In cases of low-grade proteinuria, the ratio ranges from 0.2 to 1.0; in moderate cases, it falls between 1.0 and 3.5; whereas in instances of nephrotic-range proteinuria, it surpasses 3.5. This method offers a pragmatic alternative, addressing the practical limitations of the 24-hour collection process and providing valuable insights into protein excretion levels.
Microalbuminura
This is characterized by the urinary excretion of 30 to 300 mg/24 hours (equivalent to 2-20 mg/dl) of albumin in the urine.
Significance of Microalbuminuria
- Microalbuminuria stands as the initial indicator of renal impairment in diabetes mellitus, specifically in the context of diabetic nephropathy. This phenomenon signifies an elevation in capillary permeability to albumin, marking the onset of microvascular disease. Notably, microalbuminuria precedes the onset of diabetic nephropathy by several years. Rigorous management involving aggressive control of blood glucose levels and hypertension during this stage can significantly impede or forestall the progression toward irreversible renal damage and eventual renal failure.
- Microalbuminuria emerges as an autonomous risk factor for cardiovascular disease in individuals with diabetes mellitus.
Detection of Microalbuminuria
Microalbuminuria eludes detection through routine proteinuria tests. Various methods employed for its identification include:
- Assessing the albumin-creatinine ratio in a random urine sample
- Measuring albumin levels in an early morning or random urine sample
- Determining albumin levels in a 24-hour urine sample
Commercially available test strips are designed to screen for microalbuminuria. For precise quantification, immunologic assays such as radioimmunoassay or enzyme-linked immunosorbent assay (ELISA) can be employed.
Bence Jones Proteinuria
Bence Jones proteins, integral to the realm of plasma cell dyscrasias like multiple myeloma and primary amyloidosis, represent monoclonal immunoglobulin light chains—either κ or λ—synthesized by neoplastic plasma cells. The heightened production of these light chains leads to their excess presence, resulting in overflow proteinuria as they are excreted in urine.
These proteins exhibit a distinctive thermal behavior. Upon heating, Bence Jones proteins precipitate within the temperature range of 40°C to 60°C— a phenomenon setting them apart, as other proteins typically precipitate between 60-70°C. Notably, the precipitate vanishes upon further heating at 85-100°C, a behavior not shared by other proteins. Upon cooling within the range of 60-85°C, the precipitate of Bence Jones proteins reappears. It is crucial to note that while this test provides insights, it lacks specificity for Bence Jones proteins, and both false-positive and -negative results can arise. Consequently, the contemporary standard involves protein electrophoresis of a concentrated urine sample (see Figure 4).
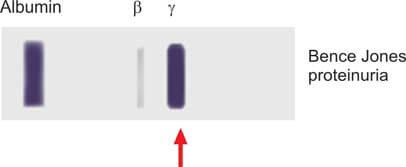
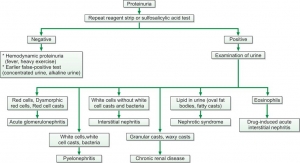
Figure 5 illustrates the subsequent assessment of enduring overt proteinuria.
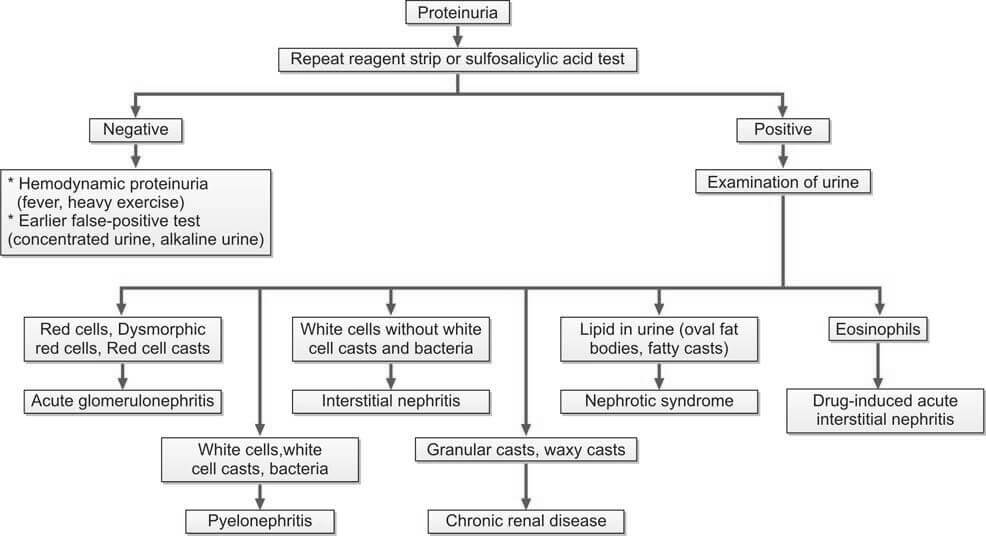
It is important to note that quantifying proteins and assessing creatinine clearance are conducted for all patients experiencing persistent proteinuria.
Glucose in Urine: Purpose, Procedure, and Results
Glucose, a primary source of energy for the body, is meticulously regulated to maintain optimal physiological functioning. However, when the delicate balance is disrupted, as seen in diabetes, glucose levels in the blood can spill into the urine, signaling an underlying issue. The tests designed for the detection of glucose in urine play a pivotal role in diagnosing and managing diabetes and other metabolic disorders.
1. Copper Reduction Methods
A. Benedict’s qualitative test
When we boil urine in Benedict's solution, a blue copper sulfate turns into a red-brown cuprous oxide, indicating the presence of a reducing agent (see Figure 1). The intensity of this color change relates to how much of the reducing substance is present. It's important to note that while this test provides valuable information, it isn't exclusive to glucose—it can detect various reducing agents in urine.

Some sugars (such as lactose, fructose, galactose, and pentoses), specific body substances (like glucuronic acid, homogentisic acid, uric acid, and creatinine), and various medications (including ascorbic acid, salicylates, cephalosporins, penicillins, streptomycin, isoniazid, para-aminosalicylic acid, nalidixic acid, etc.) also cause a reduction in alkaline copper sulfate solution.
Method
- Get a test tube and put 5 ml of Benedict's qualitative reagent in it. (Benedict's reagent is made up of copper sulfate, sodium carbonate, sodium citrate, and distilled water.)
- Add 0.5 ml (or 8 drops) of urine to the test tube and mix it well.
- Boil the mixture over a flame for 2 minutes.
- Let it cool to room temperature.
- Observe any color change.
The test is sensitive to about 200 mg of reducing substance per dl of urine. While Benedict's test reacts positively with carbohydrates other than glucose, it's also used to screen for inborn errors of carbohydrate metabolism in infants and children, detecting galactose, lactose, fructose, maltose, and pentoses in urine.
If you're only checking for glucose in urine, it's preferable to use reagent strips.
Results are reported in grades as follows:
- Nil: No change from blue color.
- Trace: Green without precipitate.
- 1+ (approx. 0.5 grams/dl): Green with precipitate.
- 2+ (approx. 1.0 grams/dl): Brown precipitate.
- 3+ (approx. 1.5 grams/dl): Yellow-orange precipitate.
- 4+ (> 2.0 grams/dl): Brick-red precipitate.
B. Clinitest tablet method (Copper reduction tablet test):
This test is like the Benedict’s test, but the chemicals are in tablet form (copper sulfate, citric acid, sodium carbonate, and anhydrous sodium hydroxide). It can detect glucose at a sensitivity of 200 mg/dl.
2. Reagent Strip Method
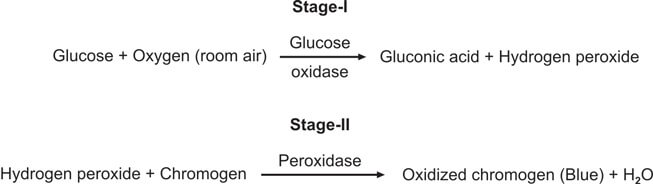
This test is special for checking glucose and is better than Benedict’s and Clinitest methods. It works by using the glucose oxidase-peroxidase reaction. The strip has two enzymes (glucose oxidase and peroxidase) and a color-changing substance. When glucose is present, it reacts with glucose oxidase to make hydrogen peroxide and gluconic acid. The color-changing substance reacts with the hydrogen peroxide, causing a color change (see Figure 3). Different strips have different color substances and buffers.
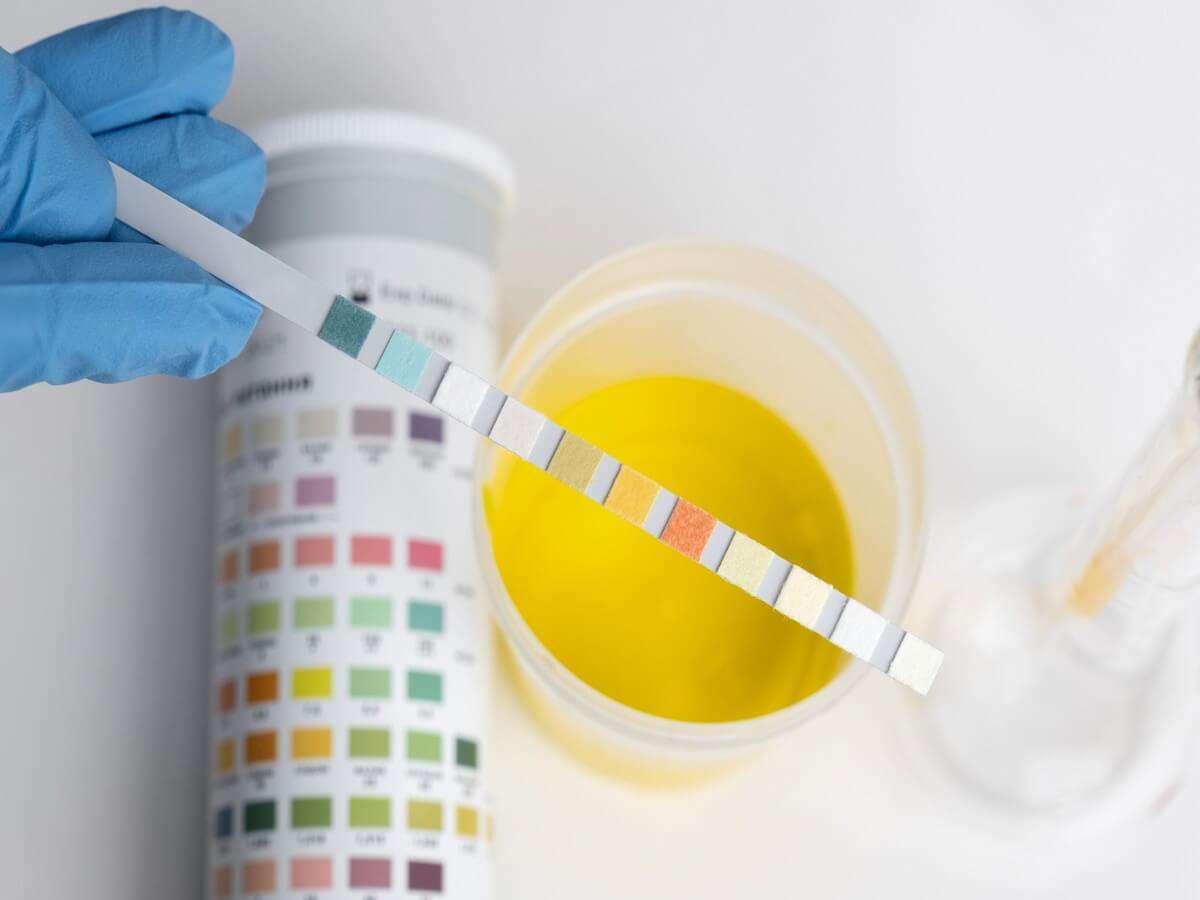
You dip the strip in the urine, wait for a bit, and then compare the color to a chart (see Figure 2).

This test is better than Benedict’s for finding glucose, and it only reacts to glucose, not other substances.
It can detect about 100 mg of glucose in a deciliter of urine.
However, be aware that the test might show a false positive if there's bleach or hypochlorite (used for cleaning urine containers) around, as they can directly affect the color change.
On the flip side, a false negative might happen if there are lots of ketones, salicylates, ascorbic acid, or a strong Escherichia coli infection. The catalase produced by the bacteria can deactivate the hydrogen peroxide used in the test.
Test for Detection of Urobilinogen in Urine
In the analysis of urinary urobilinogen, it is imperative to utilize a freshly collected urine sample. This crucial choice is rooted in the fact that, over time, urobilinogen undergoes conversion into urobilin, rendering it undetectable through routine tests. For a more nuanced examination, particularly when timing is a factor, a timed sample, such as a 2-hour postprandial collection, proves to be a valuable alternative for urobilinogen testing.
To quantify increased levels of urobilinogen in urine, two notable methods come to the forefront: the Ehrlich’s aldehyde test and the reagent strip test. These methodologies serve as reliable tools in the diagnostic arsenal, offering distinct advantages in discerning elevated urobilinogen concentrations.
Ehrlich's aldehyde test stands as a venerable technique, capitalizing on the reaction between urobilinogen and Ehrlich's reagent. This chemical interplay results in a characteristic color change, enabling precise quantification of urobilinogen levels. This method, steeped in scientific tradition, provides a meticulous approach for discerning subtle variations in urobilinogen concentration.
Complementing this, the reagent strip test emerges as a modern and efficient means of urobilinogen detection. This method capitalizes on advanced chemical indicators incorporated into specialized strips. These strips undergo specific reactions with urobilinogen, yielding color changes that can be quantified to gauge the concentration accurately. The reagent strip test, with its rapid and user-friendly nature, aligns with contemporary demands in clinical settings.
Ehrlich’s Aldehyde Test
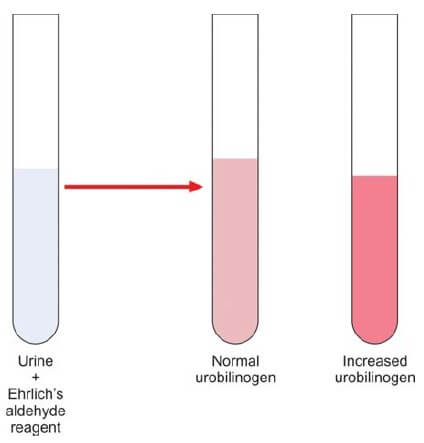
Ehrlich’s reagent, also known as pdimethylaminobenzaldehyde, engages in a distinctive reaction with urobilinogen within urine, culminating in the manifestation of a discernible pink color. The intensity of this coloration serves as a direct correlate to the concentration of urobilinogen present in the specimen. It is crucial to note that the presence of bilirubin can impede this reaction. Consequently, in cases where bilirubin is detected, it becomes imperative to eliminate its interference.
To address the interference posed by bilirubin, a meticulous process is employed. Equal volumes of the urine specimen and a 10% solution of barium chloride are thoroughly amalgamated and subsequently subjected to filtration. The ensuing filtrate serves as the medium for conducting the urobilinogen test. This strategic filtration step aids in the removal of bilirubin, ensuring the fidelity of the urobilinogen reaction.
However, it is essential to exercise caution and discernment in the interpretation of results, as a parallel reaction can be induced by porphobilinogen. Porphobilinogen, a substance excreted in the urine of individuals afflicted by porphyria, shares a similar reactivity with Ehrlich's reagent, leading to analogous color changes. Thus, in the clinical assessment of urobilinogen, it becomes imperative to distinguish between the contributions of urobilinogen and porphobilinogen to the observed reactions.
Methodology for Urobilinogen Assessment
In the pursuit of accurate urobilinogen analysis, a meticulous method is prescribed to ensure precision and reliability. Commencing with a 5 ml aliquot of freshly collected urine, the protocol unfolds by introducing 0.5 ml of Ehrlich’s aldehyde reagent into a designated test tube. This reagent formulation comprises hydrochloric acid (20 ml), distilled water (80 ml), and paradimethylaminobenzaldehyde (2 gm). Following this amalgamation, the concoction is allowed to stand at room temperature for a judicious period of 5 minutes.
The interpretive nuances lie in the observed color changes. The emergence of a pink hue signifies a normal concentration of urobilinogen, offering a visual cue to the discerning analyst. Conversely, a transition into a dark red coloration serves as a pivotal indicator of an elevated urobilinogen presence, as elucidated in Figure 1.
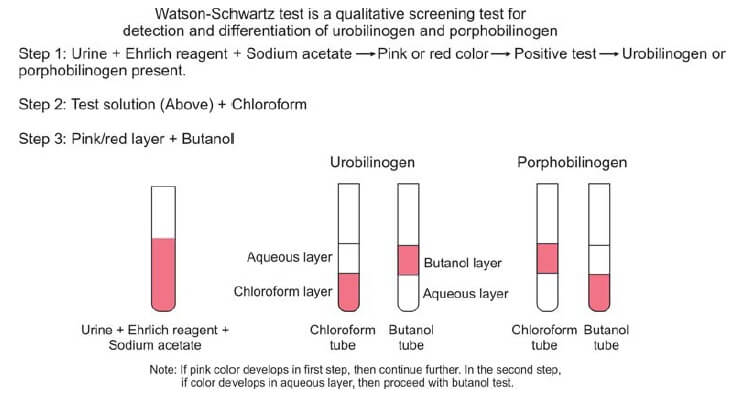
Given the potential for overlapping reactions between urobilinogen and porphobilinogen, a supplementary evaluation becomes imperative. Enter the Watson-Schwartz test, a discriminating assay designed to delineate between these chemically akin entities. With the introduction of 1-2 ml of chloroform and a subsequent two-minute agitation period, the solution undergoes a distinctive phase separation. A telltale pink coloration in the chloroform layer signifies the exclusive presence of urobilinogen, while a corresponding manifestation in the aqueous portion signals the dominance of porphobilinogen. This critical differentiation is pivotal for accurate diagnosis and is depicted in Figure 2.
To fortify the diagnostic accuracy, the pink layer is meticulously decanted and subjected to further scrutiny through interaction with butanol. A persistent pink color in the aqueous layer unequivocally indicates the presence of porphobilinogen, thus offering a conclusive resolution to the diagnostic conundrum.
Potential Factors Influencing False-Negative Reactions in Urobilinogen Testing
It is crucial to be cognizant of potential confounding factors that may lead to false-negative reactions. Two notable circumstances warrant consideration in this context.
Firstly, the presence of a urinary tract infection (UTI) introduces a dynamic that can obscure the accuracy of urobilinogen assessments. Specifically, the oxidation of urobilinogen to urobilin can occur in the presence of nitrites, a phenomenon commonly associated with UTIs. This chemical transformation during the testing process may yield a false-negative outcome, necessitating a judicious interpretation of results in the context of suspected or known UTIs.
Secondly, the impact of antibiotic therapy on urobilinogen testing integrity is noteworthy. Antibiotics, while instrumental in combatting infections, possess the capacity to disrupt the delicate balance of gut bacteria responsible for urobilinogen production. Consequently, the destruction of these bacteria can lead to a reduction in urobilinogen levels, potentially resulting in false-negative reactions during testing.
Urobilinogen Assessment via Reagent Strip Method
In the pursuit of urobilinogen quantification, the Reagent Strip Method emerges as a targeted and specialized approach. This method intricately focuses on the specific detection of urobilinogen, underscoring its precision in elucidating this particular component within urine samples.
The method hinges on the strategic impregnation of the test area with either p-dimethylaminobenzaldehyde or 4-methoxybenzene diazonium tetrafluoroborate. These meticulously chosen reagents serve as discriminating agents, interacting selectively with urobilinogen to yield discernible reactions. The deliberate incorporation of these compounds into the test area ensures a high level of specificity, facilitating the accurate identification and quantification of urobilinogen amidst the complex milieu of urinary components.
Porphyrias: Laboratory Tests, Diagnosis and Treatment

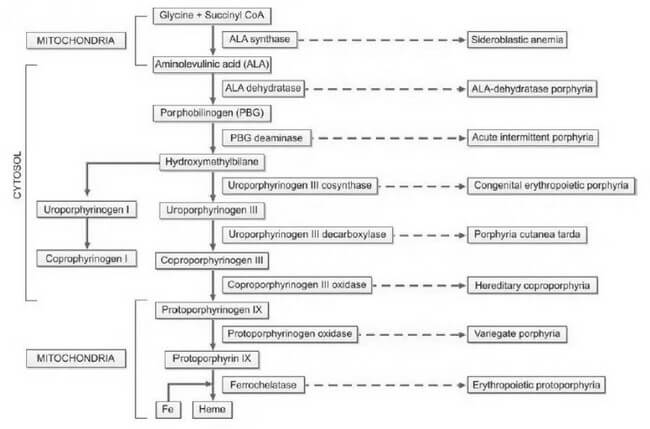
Porphyrias, derived from the Greek word "porphura," meaning purple pigment, encompass a diverse array of rare disorders arising from disruptions in the heme biosynthetic pathway. This disturbance leads to the abnormal accumulation of red and purple pigments known as porphyrins within the body. Heme, an integral component of hemoglobin, undergoes synthesis through a series of distinct steps, as illustrated in Figure 1. Each step is facilitated by a specific enzyme. In instances where any of these enzymatic processes falter due to hereditary or acquired causes, precursor molecules of heme, referred to as porphyrin intermediates, amass in the blood, deposit in the skin and various organs, and are excreted in urine and feces.
The categorization of porphyrias is contingent upon the location of the defect, resulting in different types with diverse clinical manifestations, severity levels, and the specific nature of accumulated porphyrin.
Historically, porphyria has been postulated as a potential explanation for medieval tales of vampires and werewolves. This conjecture arises from notable parallels between the behaviors exhibited by individuals afflicted with porphyria and the characteristics found in folklore. These similarities include light aversion, skin mutilation upon sunlight exposure, red teeth, psychiatric disturbances, and the consumption of blood to obtain heme.
Detection and accurate diagnosis of porphyrias pose significant challenges, often leading to oversight or misdiagnosis. Many porphyrias lack definitive physical findings, screening tests may produce false-negative results, diagnostic criteria are ambiguously defined, and mild disorders may yield enzyme assay results within the ostensibly 'normal' range.
Heme plays a crucial role in both bone marrow, where it is essential for hemoglobin synthesis, and the liver, where it is vital for cytochromes. Consequently, porphyrias are classified into erythropoietic and hepatic types based on the site of disease expression. Hepatic porphyrias predominantly impact the nervous system, while erythropoietic porphyrias primarily affect the skin. Furthermore, porphyrias are categorized as acute and nonacute (or cutaneous) types based on their clinical presentations, as outlined in Table 1. This systematic classification enhances our understanding of porphyrias, aiding clinicians, researchers, and medical professionals in comprehending the nuances of these complex disorders.
| Classification based on predominant clinical manifestations | Classification based on site of expression of disease | Classification based on mode of clinical presentation |
|---|---|---|
| Neuropsychiatric | Hepatic | Acute |
| Acute intermittent porphyria | ALA-dehydratase porphyria | ALA-dehydratase porphyria (Plumboporphyria) |
| ALA-dehydratase porphyria (Plumboporphyria) | Acute intermittent porphyria | Acute intermittent porphyria |
| Cutaneous (Photosensitivity) | Hereditary coproporphyria | Hereditary coproporphyria |
| Congenital erythropoietic porphyria | Variegate porphyria | Variegate porphyria |
| Porphyria cutanea tarda | Erythropoietic porphyria | Non-acute (cutaneous) |
| Erythropoietic protoporphyria | Congenital erythropoietic porphyria | Porphyria cutanea tarda |
| Mixed (Neuropsychiatric and cutaneous) | Erythropoietic protoporphyria | Congenital erythropoietic porphyria |
| Hereditary coproporphyria | Hepatic/Erythropoietic | Erythropoietic protoporphyria |
| Variegate porphyria | Porphyria cutanea tarda | - |
The inheritance patterns associated with porphyrias manifest as either autosomal dominant or recessive. The majority of acute porphyrias follow an autosomal dominant inheritance, signifying the transmission of a single abnormal gene copy. Consequently, the activity of the deficient enzyme is halved, resting at 50%. In instances where the hepatic heme level diminishes due to various factors, the activity of ALA synthase is spurred, resulting in an escalation of heme precursors up to the point of the enzyme defect. This surge in heme precursors precipitates the onset of symptoms characteristic of acute porphyria. Notably, as the heme level normalizes, the associated symptoms subside.
The accumulation of porphyrin precursors presents a noteworthy occurrence in lead poisoning, attributed to the inhibition of the enzyme aminolevulinic acid dehydratase within the heme biosynthetic pathway. This phenomenon can simulate the clinical presentation of acute intermittent porphyria.
Understanding the genetic underpinnings and enzymatic intricacies of porphyrias is crucial for clinicians, researchers, and medical professionals. The autosomal dominant inheritance pattern underscores the significance of a singular abnormal gene copy in the manifestation of acute porphyrias. Additionally, the intricate interplay between heme levels and enzymatic activity elucidates the nuanced triggers and resolution of acute porphyria symptoms. Moreover, the correlation between lead poisoning and the disruption of the heme biosynthetic pathway highlights the diagnostic challenges posed by conditions that mimic porphyric presentations, necessitating a keen clinical acumen for accurate differentiation.
Clinical Features
The clinical manifestations of porphyrias exhibit variability contingent upon the specific type of the disorder. Acute porphyrias, for instance, manifest with a spectrum of symptoms, including acute and intense abdominal pain, vomiting, constipation, chest pain, emotional and mental disturbances, seizures, hypertension, tachycardia, sensory deficits, and muscular weakness. This diverse array of clinical presentations underscores the complexity of acute porphyrias and the multisystemic impact they can exert.
In contrast, cutaneous porphyrias present a distinctive set of clinical features. Patients with cutaneous porphyrias commonly experience photosensitivity, characterized by the development of redness and blistering of the skin upon exposure to sunlight. Additional symptoms include itching, necrosis of the skin and gums, and an observable increase in hair growth over the temples. This distinctive clinical profile, outlined in Table 2, provides a comprehensive overview of the characteristic features associated with cutaneous porphyrias.
Understanding the nuanced clinical features associated with different types of porphyrias is pivotal for accurate diagnosis and effective management. The delineation of symptoms, ranging from abdominal pain and neurological manifestations in acute porphyrias to the distinctive photosensitivity and dermatological changes in cutaneous porphyrias, enhances the knowledge base for clinicians, researchers, and medical professionals. Such precision in characterizing the clinical landscape facilitates targeted interventions and improves patient outcomes.
| Porphyria | Deficient enzyme | Clinical features | Inheritance | Initial test |
|---|---|---|---|---|
| Acute intermittent porphyria (AIP)* | PBG deaminase | Acute neurovisceral attacks; triggering factors+ (e.g. drugs, diet restriction) | Autosomal dominant | Urinary PBG; urine becomes brown, red, or black on standing |
| Variegate porphyria | Protoporphyrinogen oxidase | Acute neurovisceral attacks + skin fragility, bullae | Autosomal dominant | Urinary PBG |
| Hereditary coproporphyria | Coproporphyrinogen oxidase | Acute neurovisceral attacks + skin fragility, bullae | Autosomal dominant | Urinary PBG |
| Congenital erythropoietic porphyria | Uroporphyrinogen cosynthase | Onset in infancy; skin fragility, bullae; extreme photosensitivity with mutilation; red teeth and urine (pink red urinestaining of diapers) | Autosomal recessive | Urinary/fecal total porphyrins; ultraviolet fluorescence of urine, feces, and bones |
| Porphyria cutanea tarda* | Uroporphyrinogen decarboxylase | Skin fragility, bullae | Autosomal dominant (some cases) | Urinary/fecal total porphyrins |
| Erythropoietic protoporphyria* | Ferrochelatase | Acute photosensitivity | Autosomal dominant | Free erythrocyte protoporphyrin |
| Disorders marked with * are the three most common porphyrias. PBG: Porphobilinogen |
The manifestation of symptoms in porphyrias is intricately linked to various triggers, encompassing pharmaceutical agents and lifestyle factors. Certain drugs, such as barbiturates, oral contraceptives, diazepam, phenytoin, carbamazepine, methyldopa, sulfonamides, chloramphenicol, and antihistamines, can serve as catalysts for symptoms. Emotional or physical stress, infections, dietary changes, fasting, substance abuse, premenstrual periods, smoking, and alcohol consumption also constitute potential triggers, amplifying the complexity of porphyria management.
Autosomal dominant porphyrias comprise a diverse group of disorders, including acute intermittent porphyria, variegate porphyria, porphyria cutanea tarda, erythropoietic protoporphyria (predominantly), and hereditary coproporphyria. In contrast, autosomal recessive porphyrias encompass congenital erythropoietic porphyria, erythropoietic protoporphyria (in a limited number of cases), and ALAdehydratase porphyria, also known as plumboporphyria.
Understanding the array of triggers and the genetic underpinnings of different porphyria types is pivotal for comprehensive patient care. The intricate interplay between pharmaceutical agents, lifestyle factors, and the distinct genetic characteristics of autosomal dominant and recessive porphyrias underscores the necessity for a nuanced approach in diagnosis and management. This multifaceted perspective equips medical professionals, and researchers with the knowledge required to navigate the complexities of porphyria, facilitating enhanced patient outcomes and advancing scientific understanding in the field.
Laboratory Diagnosis
The diagnosis of porphyria involves conducting tests on blood, urine, and feces, particularly during symptomatic periods. Achieving a timely and precise diagnosis is crucial for the effective management of porphyrias. Given the diverse and extensive clinical features associated with porphyrias, they are often considered in the differential diagnosis of various medical conditions. Most routine hospital laboratories are equipped to perform initial investigations when porphyria is suspected. However, for the identification of specific porphyria types, specialized laboratories with advanced testing capabilities become essential.
In the diagnostic process, blood, urine, and fecal analyses play a pivotal role, allowing for the detection of characteristic abnormalities during symptomatic phases. This comprehensive approach ensures a more accurate identification of porphyria subtypes, facilitating targeted and tailored therapeutic strategies.
Considering the intricate nature of porphyria diagnoses, collaboration with specialized laboratories becomes imperative. These facilities possess the advanced technologies and expertise required for in-depth analyses, enabling the discrimination between various porphyria types. This collaboration enhances the precision of the diagnostic process, contributing to improved patient outcomes and informed decision-making in the realm of porphyria management.
In essence, the diagnostic journey for porphyria demands a synergistic effort between routine hospital laboratories and specialized facilities, with a focus on leveraging advanced testing methodologies to unravel the complexities inherent in these conditions. This collaborative approach underscores the significance of accurate diagnostics in paving the way for effective porphyria management strategies.
Initial Studies
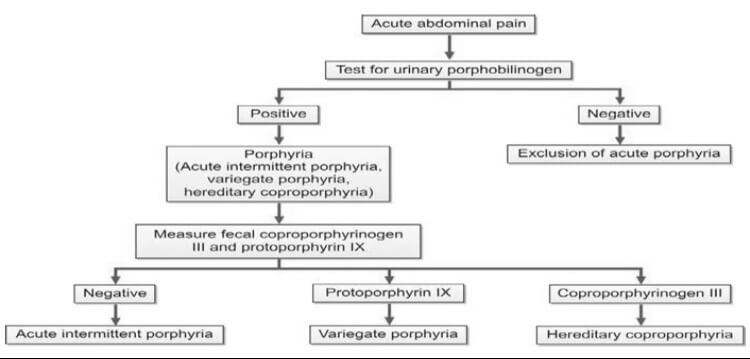
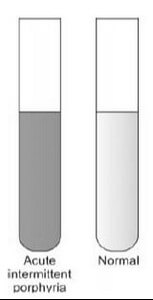
In the assessment of suspected acute porphyrias, specifically during acute neurovisceral attacks, it is imperative to submit a freshly collected, randomly obtained urine sample (10-20 ml) for the detection of heightened urinary excretion of porphobilinogen (PBG) (refer to Figure 2). Notably, in acute intermittent porphyria (AIP), the urine may exhibit a reddish or brown hue upon standing, as illustrated in Figure 3.
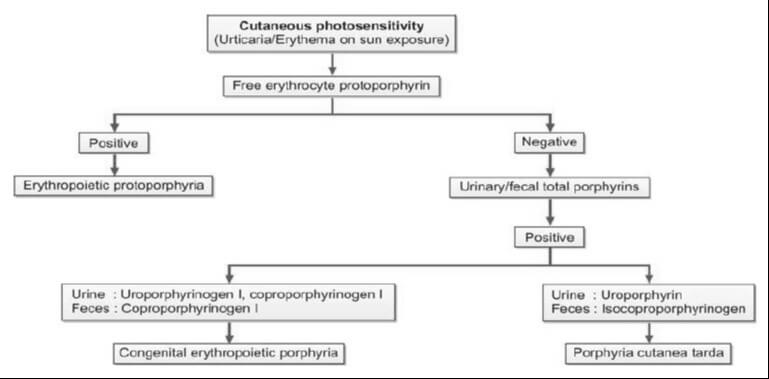
For cases where cutaneous porphyrias are suspected, with manifestations such as acute photosensitivity lacking skin fragility, a comprehensive diagnostic approach is warranted. This includes analyzing free erythrocyte protoporphyrin (FEP) in EDTA blood for the diagnosis of erythrocytic protoporphyria. Additionally, for all other cutaneous porphyrias characterized by skin fragility and bullae, an examination of fresh, random urine (10-20 ml) and either feces (5-10 g) or plasma is indispensable for identifying excess porphyrins. Detailed guidance on this diagnostic protocol is provided in Figure 4 and Table 2.
In essence, the diagnostic strategy for suspected porphyrias involves specific tests tailored to the clinical presentation. The utilization of various specimen types, including urine, blood, feces, and plasma, is crucial for the accurate identification of porphyrin abnormalities. The distinct visual cues, such as the color changes in urine associated with AIP, serve as valuable indicators in the diagnostic process. This meticulous and multifaceted approach ensures a comprehensive evaluation, facilitating precise diagnoses in the intricate landscape of porphyrias.
In addition to aiding in the diagnosis, the identification of specific heme intermediates excreted in urine or feces plays a pivotal role in pinpointing the site of defect in porphyria. Heme precursors, extending up to coproporphyrinogen III, exhibit water solubility, enabling their detection in urine. Conversely, protoporphyrinogen and protoporphyrin, being insoluble in water, are excreted through bile and can be identified in fecal samples. It is essential to shield all samples from light to preserve their integrity.
The requisite samples for a comprehensive porphyria assessment include a 10-20 ml fresh, random urine sample devoid of any preservatives, 5-10 g of wet fecal weight, and blood anticoagulated with EDTA. Each specimen type offers distinct insights into the porphyrin profile, contributing to a thorough evaluation of the disorder. The meticulous collection and analysis of these samples serve as critical steps in unraveling the intricacies of porphyria, ensuring a comprehensive understanding of the disorder's manifestations and facilitating targeted interventions.
In essence, the choice of sample type is guided by the solubility characteristics of specific heme intermediates, aligning with their excretion pathways. This systematic approach, coupled with stringent measures to protect samples from light-induced alterations, underscores the importance of precision and accuracy in the diagnostic process.
Test for Porphobilinogen in Urine
The Ehrlich’s aldehyde test serves as a diagnostic tool for detecting porphobilinogen (PBG) in urine. In this assay, Ehrlich’s reagent, composed of p-dimethylaminobenzaldehyde, reacts with PBG, resulting in the formation of a distinctive red color. The characteristic red product exhibits an absorption spectrum with a peak at 553 nm and a shoulder at 540 nm. It's noteworthy that both urobilinogen and porphobilinogen elicit a similar reaction, necessitating additional tests to discern between the two substances. To distinguish PBG from urobilinogen, solvent extraction can be employed, as outlined in the Watson-Schwartz test. This additional step is crucial for achieving specificity in the diagnostic process.
It is essential to recognize that levels of PBG might appear normal or near normal between attacks. Consequently, to mitigate the risk of false-negative results, it is imperative to conduct the test during an acute attack. This strategic timing ensures a more accurate and reliable assessment of PBG levels, contributing to a precise diagnosis and informed clinical decision-making.
Test for Total Porphyrins in Urine
The quantification of total porphyrins within an acidified urine sample is achievable through spectrophotometry, leveraging the distinct absorbance peak of porphyrins around 400 nm. This method allows for a semiquantitative estimation of porphyrin levels, providing valuable insights into the porphyrin profile present in the urine sample. Spectrophotometry, with its ability to measure the absorption of light at specific wavelengths, offers a precise and objective means of assessing the concentration of porphyrins in the given sample.
In this analytical approach, the intense absorbance peak observed around 400 nm serves as a reliable marker for the presence of porphyrins. This peak reflects the characteristic absorption spectrum of porphyrins, allowing for their identification and quantification in a systematic and accurate manner. The semiquantitative nature of the estimation enhances the diagnostic utility of the method, providing clinicians and researchers with valuable information regarding the porphyrin content in the urine.
The utilization of spectrophotometry in conjunction with acidified urine samples offers a robust technique for detecting and estimating total porphyrins. This method, marked by its precision and objectivity, contributes to the comprehensive assessment of porphyrin levels, facilitating diagnostic and research endeavors within the realm of porphyria evaluation.
Test for Total Porphyrins in Feces
The quantification of total porphyrins in fecal samples involves the use of spectrophotometry on an acidic extract of the specimen. However, a crucial preparatory step is required to eliminate interference from dietary chlorophyll, which also absorbs light around 400 nm. This interference is addressed through diethyl ether extraction, ensuring a more accurate and specific assessment of total porphyrin levels.
In the analytical process, an acidic extract of the fecal sample serves as the basis for spectrophotometric analysis. Spectrophotometry, with its ability to measure the absorption of light at specific wavelengths, allows for the precise determination of total porphyrins. The focus on an acidic environment facilitates optimal conditions for the assessment of porphyrin content.
To enhance the specificity of the analysis, the extraction of dietary chlorophyll using diethyl ether becomes imperative. This preparatory step is essential as chlorophyll absorbs light in a similar range as porphyrins, potentially leading to inaccurate measurements. By effectively removing this interference, the spectrophotometric analysis can provide more reliable and meaningful data regarding the concentration of total porphyrins in the fecal sample.
The process of determining total porphyrins in feces through spectrophotometry necessitates a meticulous approach, including the removal of dietary chlorophyll through diethyl ether extraction. This method ensures the accuracy and specificity of the analysis, contributing to the reliability of results in the evaluation of porphyrin levels in fecal samples.
Evaluation of Porphyrins in Erythrocytes and Plasma: Modern Techniques
Contemporary methodologies have supplanted traditional approaches such as visual examination for porphyrin fluorescence, as well as solvent fractionation and spectrophotometry. The advent of fluorometric methods represents a significant advancement in the analysis of porphyrins in erythrocytes and plasma.
Fluorometric techniques have emerged as the preferred means of assessing porphyrins, offering heightened precision and sensitivity compared to their predecessors. These methods leverage the unique fluorescence properties of porphyrins, providing a more refined and objective approach to their detection and quantification.
By utilizing fluorometry, researchers and medical professionals can achieve a clearer understanding of porphyrin levels in erythrocytes and plasma. This modernized approach enhances both the accuracy and efficiency of porphyrin testing, aligning with the evolving standards of scientific analysis in hematology and related fields.
This transition to fluorometric methods underscores the commitment to staying at the forefront of scientific advancements, ensuring that diagnostic and research practices remain not only rigorous but also in harmony with the latest technological innovations.
Comprehensive Assessment for Porphyria Diagnosis
Upon obtaining a positive result in the initial porphyria screening, a more in-depth analysis becomes imperative. This involves the quantification of porphyrin concentrations in urine, feces, and blood, a crucial step in establishing a precise and specific diagnosis. The tables below (Tables 3 and 4) provide detailed insights into the diagnostic criteria and reference values for this comprehensive evaluation.
By meticulously measuring porphyrin levels in these biological samples, healthcare professionals can discern the specific type and severity of porphyria, facilitating targeted and effective management strategies. This comprehensive approach not only confirms the presence of porphyria but also aids in tailoring treatment plans to the individual nuances of the patient's condition.
As with any diagnostic process, the accuracy and reliability of results depend on the proficiency of the laboratory techniques employed and the adherence to standardized protocols. This commitment to precision ensures that the gathered data is not only scientifically robust but also forms the cornerstone for informed clinical decisions and patient care.
| Porphyria | Urine | Feces |
|---|---|---|
| Acute intermittent porphyria | PBG, Copro III | – |
| Variegate porphyria | PBG, Copro III | Proto IX |
| Hereditary coproporphyria | PBG, Copro III | Copro III |
| PBG: Porphobilinogen; Copro III: Coproporphyrinogen III; Proto IX: Protoporphyrin IX. |
| Porphyria | Urine | Feces | Erythrocytes |
|---|---|---|---|
| Congenital erythropoietic porphyria | Uro I, Copro I | Copro I | – |
| Porphyria cutanea tarda | Uroporphyrin | Isocopro | – |
| Erythropoietic protoporphyria | – | – | Protoporphyrin |
| Uro I: Uroporphyrinogen I; Copro I: Coproporphyrinogen I; Isocopro: Isocoproporphyrinogen. |
Diagnostic Challenges in Latent Porphyrias and Remission Periods
During latent porphyrias and periods of remission, individuals may exhibit normal porphyrin levels, posing a diagnostic challenge. In such instances, a comprehensive approach involving enzymatic and DNA testing becomes imperative for an accurate diagnosis. These advanced testing methods delve into the genetic and enzymatic aspects, providing a more nuanced understanding of porphyria manifestation even in the absence of elevated porphyrin levels.
Upon confirming a diagnosis of porphyria, a critical next step involves the systematic examination of close family members for the presence of the disorder. This proactive approach is essential for early detection and intervention. Family members testing positive for porphyria should undergo counseling, equipping them with valuable insights into potential triggering factors and empowering them to make informed lifestyle choices that mitigate the risk of symptomatic episodes.
This meticulous diagnostic and familial investigation strategy not only aids in individual patient management but also contributes to the broader goal of familial health and well-being. By addressing latent cases and involving family members, healthcare professionals can establish a more comprehensive and effective framework for the understanding and management of porphyrias.
PLATELET GLYCOPROTEIN ANALYSIS
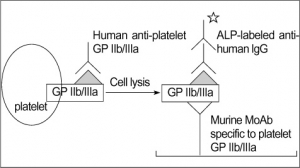
Fresh platelets should always be used. Storing platelets dramatically changes the level of transmembrane proteins. The best way is to follow one of standardized protocols defined in: Immunophenotypic analysis of platelets. Krueger LA, Barnard MR, Frelinger AL 3rd, Furman MI, Michelson AD.Curr Protoc Cytom. 2002 Feb;Chapter 6:Unit 6.10.
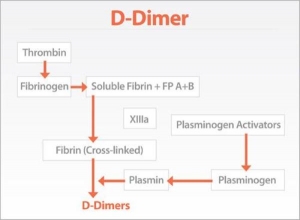
TEST FOR D-DIMER
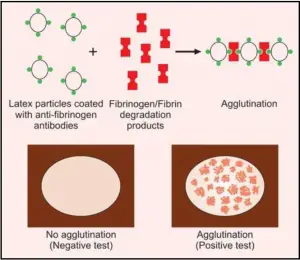
TEST FOR FIBRINOGEN/FIBRIN DEGRADATION PRODUCTS (FDPs)
Platelet Aggregation Studies
Platelet aggregation tests are carried out in specialized hematology laboratories if platelet dysfunction is suspected. These tests are usually indicated in patients presenting with the mucocutaneous type of bleeding and in whom screening tests reveal normal platelet count, prolonged bleeding time, normal prothrombin time, and normal activated partial thromboplastin time.
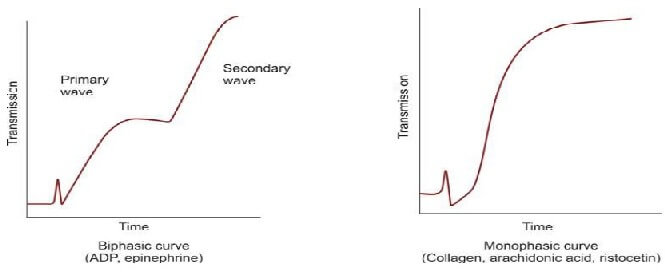
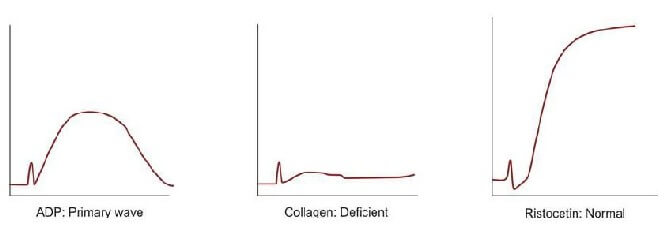
Platelet aggregation studies are carried out on platelet-rich plasma using an aggregometer. When a platelet aggregating agent is added to platelet-rich plasma, platelets form aggregates, and optical density falls (or light transmission increases); this is recorded by a chart recorder on a strip chart. Commonly used platelet aggregating agents are ADP (adenosine 5-diphosphate), epinephrine (adrenaline), collagen, arachidonic acid, and ristocetin. ADP (low dose) and epinephrine induce primary and secondary waves of aggregation (biphasic curve). The primary wave is due to the direct action of the aggregating agent on platelets. The secondary wave is due to thromboxane A2 synthesis and secretion from platelets. Collagen, arachidonic acid, and ristocetin induce a single wave of aggregation (monophasic curve) Normal aggregation curve is shown in Figure 804.1. Aggregation patterns in various platelet function defects are shown in Figures 804.2 to 804.4, and Table 804.1.
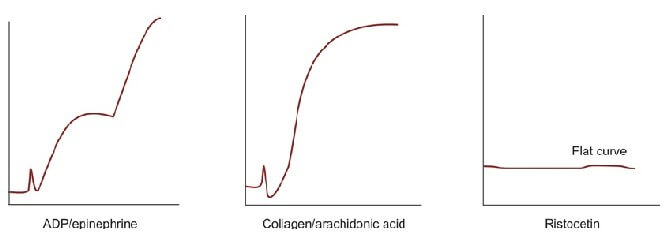

| Disorder | Platelet Aggregation pattern | Other features |
|---|---|---|
| Bernard Soulier syndrome | Normal with ADP, epinephrine, collagen, and arachidonic acid; deficient with ristocetin | Autosomal recessive; severe bleeding; giant platelets |
| Glanzmann's thrombasthenia | Deficient with ADP, epinephrine, collagen, and arachidonic acid; normal with ristocetin | Autosomal recessive; severe bleeding; small and discrete platelets; defective clot retraction |
| Storage pool defect | Primary wave with ADP and epinephrine, normal with arachidonic acid, deficient with collagen, normal with ristocetin | Defects of platelets granules; platelet dense granules are decreased with the deficient release of ADP, ATP, calcium, and serotonin |
| Aspirin-like defect | Primary wave with ADP and epinephrine, deficient with arachidonic acid, deficient with collagen, normal with ristocetin | - |
| von Willebrand disease | Normal with ADP, epinephrine, collagen, and arachidonic acid; deficient with ristocetin | Autosomal dominant/recessive; abnormality in aggregation corrected with cryoprecipitate |
EXAMINATION OF BLOOD SMEAR
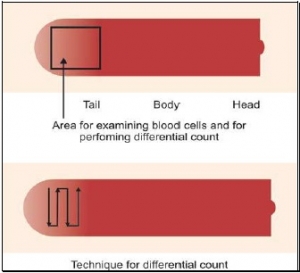
- Red cells: Morphology, immature forms, inclusion bodies, arrangement of cells.
- White cells: Differential count, abnormal or immature forms.
- Platelets: Adequacy, abnormal forms.
- Parasites: Malaria, filaria.
MORPHOLOGY OF PLATELETS
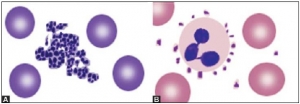
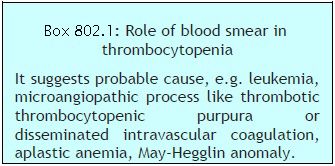 Platelets are small, 1-3 μm in diameter, purple structures with tiny irregular projections on surface. In blood films prepared from non-anticoagulated blood (i.e. direct fingerstick), they occur in clumps. If platelet count is done on automated blood cell counters using EDTA-anticoagulated blood sample, about 1% of persons show falsely low count due to the presence in them of EDTA dependent antiplatelet antibody. Examination of a parallel blood film is useful in avoiding the false diagnosis of thrombocytopenia in such cases. Occasionally, platelets show rosetting around neutrophils (platelet satellitism) (see Figure 802.1). This is seen in patients with platelet antibodies and in apparently normal persons. Blood smear examination can be helpful in determining underlying cause of thrombocytopenia such as leukemia, lymphoma, or microangiopathic hemolytic anemia (Box 802.1).
NUMERICAL ABNORMALITIES OF LEUKOCYTES
- Acute bacterial infections: Abscess, pneumonia, meningitis, septicemia, acute rheumatic fever, urinary tract infection.
- Tissue necrosis: Burns, injury, myocardial infarction.
- Acute blood loss
- Acute hemorrhage
- Myeloproliferative disorders
- Metabolic disorders: Uremia, acidosis, gout
- Poisoning
- Malignant tumors
- Physiologic causes: Exercise, labor, pregnancy, emotional stress.
- Severe bacterial infections, e.g. septicemia, pneumonia
- Severe hemorrhage
- Severe acute hemolysis
- Poisoning
- Burns
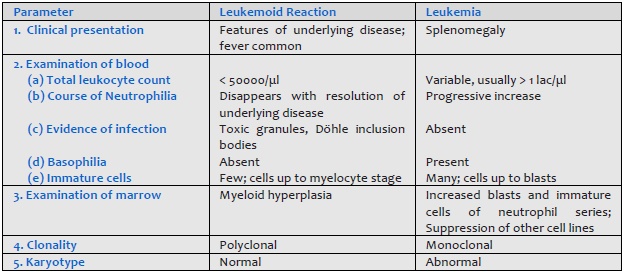
- Carcinoma metastatic to bone marrow Leukemoid reaction should be differentiated from chronic myeloid leukemia (Table 801.1).
- Infections
(a) Bacterial: typhoid, paratyphoid, miliary tuberculosis, septicemia
(b) Viral: influenza, measles, rubella, infectious mononucleosis, infective hepatitis.
(c) Protozoal: malaria, kala azar
(d) Overwhelming infection by any organism - Hematologic disorders: megaloblastic anemia, aplastic anemia, aleukemic leukemia, myelophthisis.
- Drugs:
(a) Idiosyncratic action: Analgesics, antibiotics, sulfonamides, phenothiazines, antithyroid drugs, anticonvulsants.
(b) Dose-related: Anticancer drugs - Ionizing radiation
- Congenital disorders: Kostman's syndrome, cyclic neutropenia, reticular dysgenesis.
- Neonatal isoimmune neutropaenia
- Systemic lupus erythematosus
- Felty's syndrome
- Hypersplenism
- Allergic diseases: Bronchial asthma, rhinitis, urticaria, drugs.
- Skin diseases: Eczema, pemphigus, dermatitis herpetiformis.
- Parasitic infection with tissue invasion: Filariasis, trichinosis, echinococcosis.
- Hematologic disorders: Chronic Myeloproliferative disorders, Hodgkin's disease, peripheral T cell lymphoma.
- Carcinoma with necrosis.
- Radiation therapy.
- Lung diseases: Loeffler's syndrome, tropical eosinophilia
- Hypereosinophilic syndrome.
- Infections: Tuberculosis, subacute bacterial endocarditis, malaria, kala azar.
- Recovery from neutropenia.
- Autoimmune disorders.
- Hematologic diseases: Myeloproliferative disorders, monocytic leukemia, Hodgkin's disease.
- Others: Chronic ulcerative colitis, Crohn's disease, sarcoidosis.
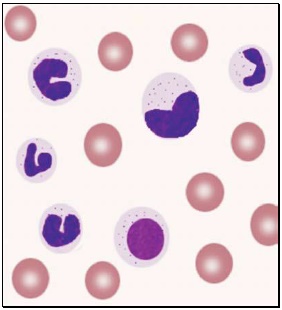
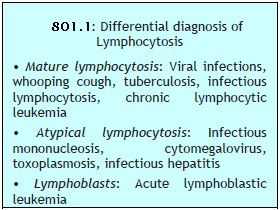 This is an increase in absolute lymphocyte count above upper limit of normal for age (4000/μl in adults, >7200/μl in adolescents, >9000/μl in children and infants) (Box 801.1).
- Infections:
(a) Viral: Acute infectious lymphocytosis, infective hepatitis, cytomegalovirus, mumps, rubella, varicella
(b) Bacterial: Pertussis, tuberculosis
(c) Protozoal: Toxoplasmosis - Hematological disorders: Acute lymphoblastic leukemia, chronic lymphocytic leukemia, multiple myeloma, lymphoma.
- Other: Serum sickness, post-vaccination, drug reactions.
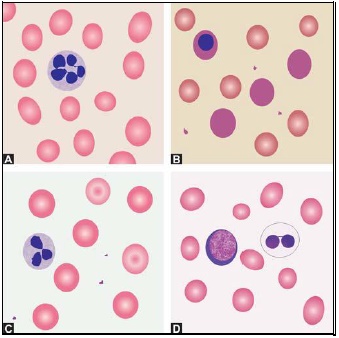
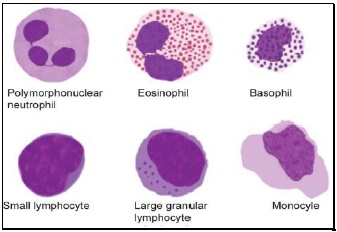
WHITE BLOOD CELLS MORPHOLOGY
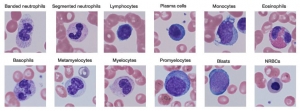
- Polymorphonuclear neutrophil: Neutrophil measures 14-15 μm in size. Its cytoplasm is colorless or lightly eosinophilic and contains multiple, small, fine, mauve granules. Nucleus has 2-5 lobes that are connected by fine chromatin strands. Nuclear chromatin is condensed and stains deep purple in color. A segmented neutrophil has at least 2 lobes connected by a chromatin strand. A band neutrophil shows non-segmented U-shaped nucleus of even width. Normally band neutrophils comprise less than 3% of all leukocytes. Majority of neutrophils have 3 lobes, while less than 5% have 5 lobes. In females, 2-3% of neutrophils show a small projection (called drumstick) on the nuclear lobe. It represents one inactivated X chromosome.
- Eosinophil: Eosinophils are slightly larger than neutrophils (15-16 μm). The nucleus is often bilobed and the cytoplasm is packed with numerous, large, bright orange-red granules. On blood smears, some of the eosinophils are often ruptured.
- Basophils: Basophils are seen rarely on normal smears. They are small (9-12 μm), round to oval cells, which contain very large, coarse, deep purple granules. It is difficult to make out the nucleus since granules cover it.
- Monocytes: Monocyte is the largest of the leukocytes (15-20 μm). It is irregular in shape, with oval or clefted (kidney-shaped) nucleus and fine, delicate chromatin. Cytoplasm is abundant, bluegray with ground glass appearance and often contains fine azurophil granules and vacuoles. After migration to the tissues from blood, they are called as macrophages.
- Lymphocytes: On peripheral blood smear, two types of lymphocytes are distinguished: small and large. The majority of lymphocytes are small (7-8 μm). These cells have a high nuclearcytoplasmic ratio with a thin rim of deep blue cytoplasm. The nucleus is round or slightly clefted with coarsely clumped chromatin. Large lymphocytes (10-15 μm) have a more abundant, pale blue cytoplasm, which may contain a few azurophil granules. Nucleus is oval or round and often placed on one side of the cell.
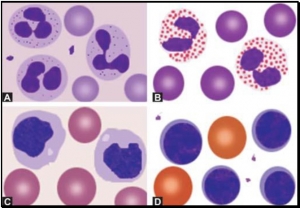
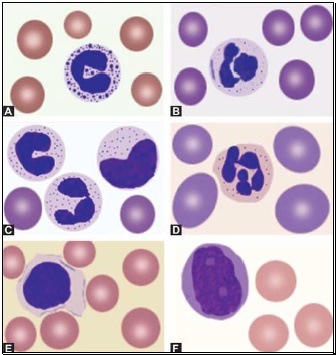
 Toxic granules: These are darkly staining, bluepurple, coarse granules in the cytoplasm of neutrophils. They are commonly seen in severe bacterial infections.
- Döhle inclusion bodies: These are small, oval, pale blue cytoplasmic inclusions in the periphery of neutrophils. They represent remnants of ribosomes and rough endoplasmic reticulum. They are often associated with toxic granules and are seen in bacterial infections.
- Cytoplasmic vacuoles: Vacuoles in neutrophils are indicative of phagocytosis and are seen in bacterial infections.
- Shift to left of neutrophils: This refers to presence of immature cells of neutrophil series (band forms and metamyelocytes) in peripheral blood and occurs in infections and inflammatory disorders.
- Hypersegmented neutrophils: Hypersegmentation of neutrophils is said to be present when >5% of neutrophils have 5 or more lobes. They are large in size and are also called as macropolycytes. They are seen in folate or vitamin B12 deficiency and represent one of the earliest signs.
- Pelger-Huet cells: In Pelger-Huet anomaly (a benign autosomal dominant condition), there is failure of nuclear segmentation of granulocytes so that nuclei are rod-like, round, or have two segments. Such granulocytes are also observed in myeloproliferative disorders (pseudo-Pelger-Huet cells).
- Atypical lymphocytes: These are seen in viral infections, especially infectious mononucleosis. Atypical lymphocytes are large, irregularly shaped lymphocytes with abundant cytoplasm and irregular nuclei. Cytoplasm shows deep basophilia at the edges and scalloping of borders. Nuclear chromatin is less dense and occasional nucleolus may be present.
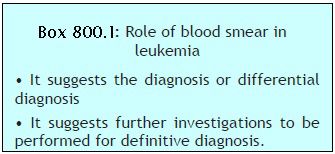
- Blast cells: These are most premature of the leukocytes. They are large (15-25 μm), round to oval cells, with high nuclear cytoplasmic ratio. Nucleus shows one or more nucleoli and nuclear chromatin is immature. These cells are seen in severe infections, infiltrative disorders, and leukemia. In leukemia and lymphoma, blood smear suggests the diagnosis or differential diagnosis and helps in ordering further tests (see Figure 800.2 and Box 800.1).
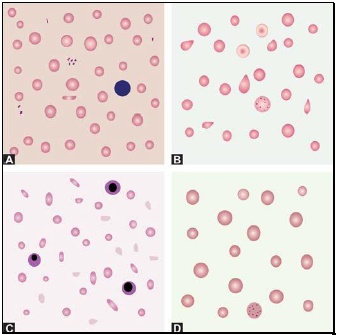
RED CELLS MORPHOLOGY
 Red cells are best examined in an area where they are just touching one another (towards the tail of the film). Normal red cells are 7-8 μm in size, round with smooth contours, and stain deep pink at the periphery and paler in the center. Area of central pallor is about 1/3rd the diameter of the red cell. Size of a normal red cell corresponds roughly with the size of the nucleus of a small lymphocyte. Normal red cells are described as normocytic (of normal size) and normochromic (with normal staining intensity i.e. hemoglobin content).
- Red cells with abnormal size (see Figure 799.1)
- Red cells with abnormal staining
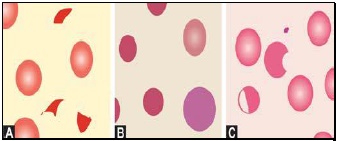
- Red cells with abnormal shape (see Figure 799.1)
- Red cell inclusions (see Figure 799.2)
- Immature red cells (see Figure799.3)
- Abnormal red cell arrangement(see Figure 799.4).
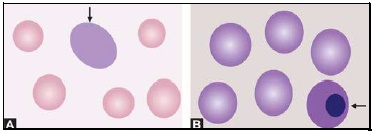
Macrocytes are red cells larger in size than normal. Oval macrocytes (macro-ovalocytes) are seen in megaloblastic anemia, myelodysplastic syndrome, and in patients being treated with cancer chemotherapy. Round macrocytes are seen in liver disease, alcoholism, and hypothyroidism.
Staining intensity of red cells depends on hemoglobin content. Red cells with increased area of central pallor (i.e. containing less hemoglobin) are called as hypochromic. They are seen when hemoglobin synthesis is defective, i.e. in iron deficiency, thalassemias, anaemia of chronic disease, and sideroblastic anemia.
Basophilic stippling or punctate basophilia refers to the presence of numerous, irregular basophilic (purple-blue) granules which are uniformly distributed in the red cell. These granules represent aggregates of ribosomes. Their presence is indicative of impaired erythropoiesis and they are seen in thalassemias, megaloblastic anemia, heavy metal poisoning (e.g. lead), and liver disease.cell. These granules represent aggregates of ribosomes. Their presence is indicative of impaired erythropoiesis and they are seen in thalassemias, megaloblastic anemia, heavy metal poisoning (e.g. lead), and liver disease.
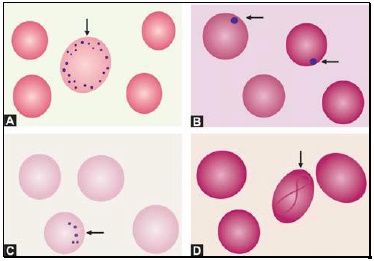
Pappenheimer bodies are basophilic, small, ironcontaining granules in red cells. They give positive Perl's Prussian blue reaction. Unlike basophilic stippling, Pappenheimer bodies are few in number and are not distributed throughout the red cell. They are seen following splenectomy and in thalassemias and sideroblastic anemia.
Cabot's rings are fine, reddish-purple or red, ring-like structures. They appear like loops or figure of eight structures. They indicate impaired erythropoiesis and are seen in megaloblastic anemia and lead poisoning.
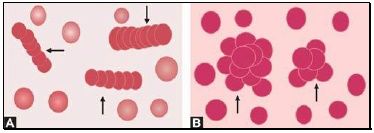
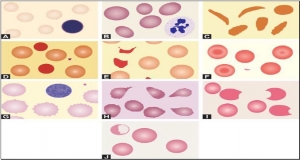
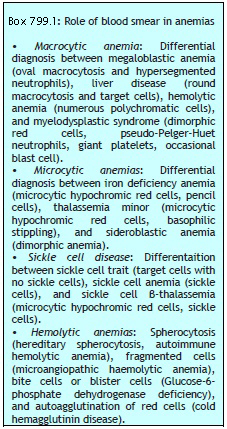
Autoagglutination refers to the clumping of red cells in large, irregular groups on blood smear. It is seen in cold agglutinin disease. Role of blood smear in anemia is shown in Box 799.1 and Figures 799.5 to 799.7.