Displaying items by tag: Diseases and Disorders
CHEMICAL EXAMINATION OF FECES
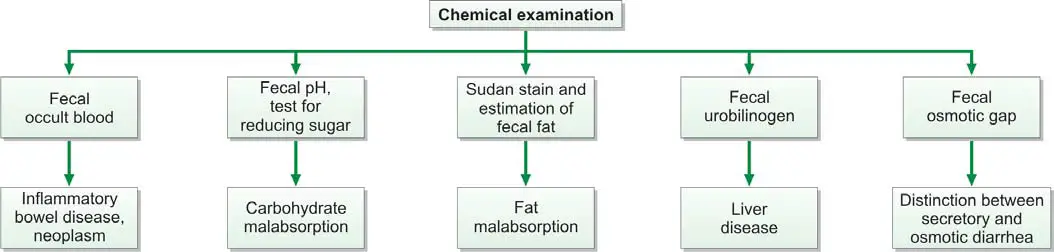
Chemical examination of feces is usually carried out for the following tests (Figure 845.1):
- Occult blood
- Excess fat excretion (malabsorption)
- Urobilinogen
- Reducing sugars
- Fecal osmotic gap
- Fecal pH
Test for Occult Blood in Stools
Presence of blood in feces which is not apparent on gross inspection and which can be detected only by chemical tests is called as occult blood. Causes of occult blood in stools are:
- Intestinal diseases: hookworms, amebiasis, typhoid fever, ulcerative colitis, intussusception, adenoma, cancer of colon or rectum.
- Gastric and esophageal diseases: peptic ulcer, gastritis, esophageal varices, hiatus hernia.
- Systemic disorders: bleeding diathesis, uremia.
- Long distance runners.
Occult blood test is recommended as a screening procedure for detection of asymptomatic colorectal cancer. Yearly examinations should be carried out after the age of 50 years. If the test is positive, endoscopy and barium enema are indicated.
Tests for detection of occult blood in feces: Many tests are available which differ in their specificity and sensitivity. These tests include tests based on peroxidase-like activity of hemoglobin (benzidine, orthotolidine, aminophenazone, guaiac), immunochemical tests, and radioisotope tests.
Tests Based on Peroxidase-like Activity of Hemoglobin
Principle: Hemoglobin has peroxidase-like activity and releases oxygen from hydrogen peroxide. Oxygen molecule then oxidizes the chemical reagent (benzidine, orthotolidine, aminophenazone, or guaiac) to produce a colored reaction product.
Benzidine and orthotolidine are carcinogenic and are no longer used. Benzidine test is also highly sensitive and false-positive reactions are common. Since bleeding from the lesion may be intermittent, repeated testing may be required.
Causes of False-positive Tests
- Ingestion of peroxidase-containing foods like red meat, fish, poultry, turnips, horseradish, cauliflower, spinach, or cucumber. Diet should be free from peroxidase-containing foods for at least 3 days prior to testing.
- Drugs like aspirin and other anti-inflammatory drugs, which increase blood loss from gastrointestinal tract in normal persons.
Causes of False-negative Tests
- Foods containing large amounts of vitamin C.
- Conversion of all hemoglobin to acid hematin (which has no peroxidase-like activity) during passage through the gastrointestinal tract.
Immunochemical Tests
These tests specifically detect human hemoglobin. Therefore there is no interference from animal hemoglobin or myoglobin (e.g. meat) or peroxidase-containing vegetables in the diet.
The test consists of mixing the sample with latex particles coated with anti-human haemoglobin antibody, and if agglutination occurs, test is positive. This test can detect 0.6 ml of blood per 100 grams of feces.
Radioisotope Test Using 51Cr
In this test, 10 ml of patient’s blood is withdrawn, labeled with 51Cr, and re-infused intravenously. Radioactivity is measured in fecal sample and in simultaneously collected blood specimen. Radioactivity in feces indicates gastrointestinal bleeding. Amount of blood loss can be calculated. Although the test is sensitive, it is not suitable for routine screening.
Apt test: This test is done to decide whether blood in the vomitus or in the feces of a neonate represents swallowed maternal blood or is the result of bleeding in the gastrointestinal tract. The test was devised by Dr. Apt and hence the name. The baby swallows blood during delivery or during breastfeeding if nipples are cracked. Apt test is based on the principle that if blood is of neonatal origin it will contain high proportion of hemoglobin F (Hb F) that is resistant to alkali denaturation. On the other hand, maternal blood mostly contains adult hemoglobin or Hb A that is less resistant.
Test for Malabsorption of Fat
Dietary fat is absorbed in the small intestine with the help of bile salts and pancreatic lipase. Fecal fat mainly consists of neutral fats (unsplit fats), fatty acids, and soaps (fatty acid salts). Normally very little fat is excreted in feces (<7 grams/day in adults). Excess excretion of fecal fat indicates malabsorption and is known as steatorrhea. It manifests as bulky, frothy, and foul-smelling stools, which float on the surface of water.
Causes of Malabsorption of Fat
- Deficiency of pancreatic lipase (insufficient lipolysis): chronic pancreatitis, cystic fibrosis.
- Deficiency of bile salts (insufficient emulsification of fat): biliary obstruction, severe liver disease, bile salt deconjugation due to bacterial overgrowth in the small intestine.
- Diseases of small intestine: tropical sprue, celiac disease, Whipple’s disease.
Tests for fecal fat are qualitative (i.e. direct microscopic examination after fat staining), and quantitative (i.e. estimation of fat by gravimetric or titrimetric analysis).
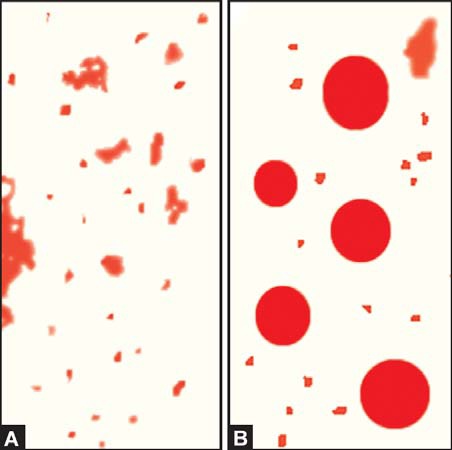
- Microscopic stool examination after staining for fat: A random specimen of stool is collected after putting the patient on a diet of >80 gm fat per day. Stool sample is stained with a fat stain (oil red O, Sudan III, or Sudan IV) and observed under the microscope for fat globules (Figure 845.2). Presence of ≥60 fat droplets/HPF indicates steatorrhea. Ingestion of mineral or castor oil and use of rectal suppositories can cause problems in interpretation.
- Quantitative estimation of fecal fat: The definitive test for diagnosis of fat malabsorption is quantitation of fecal fat. Patient should be on a diet of 70-100 gm of fat per day for 6 days before the test. Feces are collected over 72 hours and stored in a refrigerator during the collection period. Specimen should not be contaminated with urine. Fat quantitation can be done by gravimetric or titrimetric method. In gravimetric method, an accurately weighed sample of feces is emulsified, acidified, and fat is extracted in a solvent; after evaporation of solvent, fat is weighed as a pure compound. Titrimetric analysis is the most widely used method. An accurately weighed stool sample is treated with alcoholic potassium hydroxide to convert fat into soaps. Soaps are then converted to fatty acids by the addition of hydrochloric acid. Fatty acids are extracted in a solvent and the solvent is evaporated. The solution of fat made in neutral alcohol is then titrated against sodium hydroxide. Fatty acids comprise about 80% of fecal fat. Values >7 grams/day are usually abnormal. Values >14 grams/day are specific for diseases causing fat malabsorption.
Test for Urobilinogen in Feces
Fecal urobilinogen is determined by Ehrlich’s aldehyde test (see Article “Test for Detection of Urobilinogen in Urine”). Specimen should be fresh and kept protected from light. Normal amount of urobilinogen excreted in feces is 50-300 mg per day. Increased fecal excretion of urobilinogen is seen in hemolytic anemia. Urobilinogen is deceased in biliary tract obstruction, severe liver disease, oral antibiotic therapy (disturbance of intestinal bacterial flora), and aplastic anemia (low hemoglobin turnover). Stools become pale or clay-colored if urobilinogen is reduced or absent.
Test for Reducing Sugars
Deficiency of intestinal enzyme lactase is a common cause of malabsorption. Lactase converts lactose (in milk) to glucose and galactose. If lactase is deficient, lactose is converted to lactic acid with production of gas. In infants this leads to diarrhea, vomiting, and failure to thrive. Benedict’s test or Clinitest™ tablet test for reducing sugars is used to test freshly collected stool sample for lactose. In addition, oral lactose tolerance test is abnormal (after oral lactose, blood glucose fails to rise above 20 mg/dl of basal value) in lactase deficiency. Rise in blood glucose indicates that lactose has been hydrolysed and absorbed by the mucosa. Lactose tolerance test is now replaced by lactose breath hydrogen testing. In lactase deficiency, accumulated lactose in the colon is rapidly fermented to organic acids and gases like hydrogen. Hydrogen is absorbed and then excreted through the lungs into the breath. Amount of hydrogen is then measured in breath; breath hydrogen more than 20 ppm above baseline within 4 hours indicates positive test.
Fecal Osmotic Gap
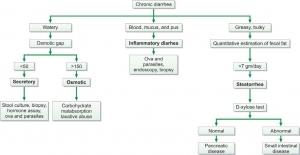
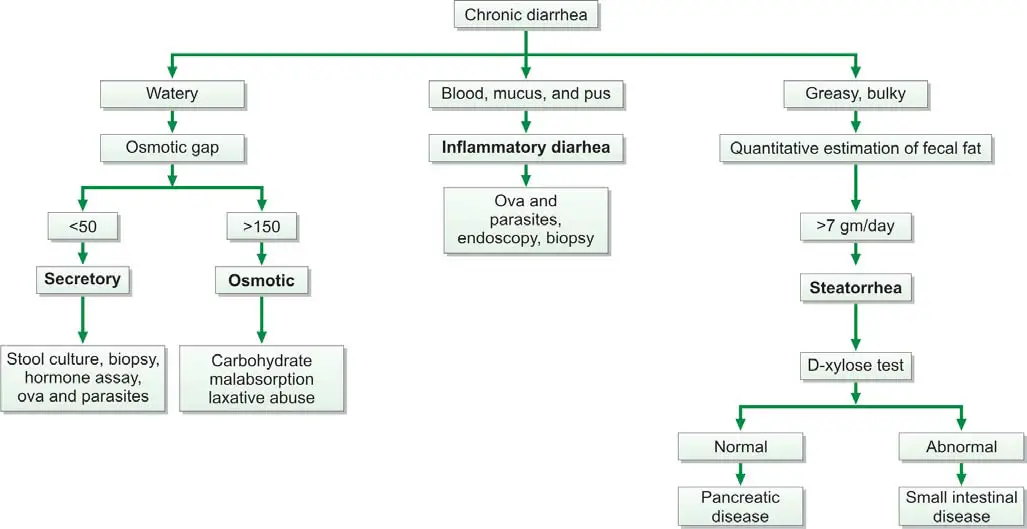
Fecal osmotic gap is calculated from concentration of electrolytes in stool water by formula 290-2([Na+] + [K+]). (290 is the assumed plasma osmolality). In osmotic diarrheas, osmotic gap is >150 mOsm/kg, while in secretory diarrhea, it is typically below 50 mOsm/kg. Evaluation of chronic diarrhea is shown in Figure 845.3.
Fecal pH
Stool pH below 5.6 is characteristic of carbohydrate malabsorption.
Laboratory Tests to Evaluate Tubular Function
These diagnostic assessments are designed to evaluate the performance of two crucial components of the kidney – the proximal and distal tubules. Proximal tubular function tests, such as Fractional Excretion of Sodium (FENa) and Tubular Reabsorption of Phosphate (TRP), gauge the efficiency of reabsorption in the proximal tubule. On the other hand, tests for distal tubular function, like the Urine Acidification Test, focus on the tubule's ability to maintain the body's acid-base balance. These tests play an important role in diagnosing renal disorders by providing valuable information on the specific functionalities of these intricate renal structures.
Tests to Assess Proximal Tubular Function
The renal tubules play a crucial role in reabsorbing 99% of the glomerular filtrate to retain vital substances such as glucose, amino acids, and water.
Glycosuria
Renal glycosuria manifests as the excretion of glucose in urine despite normal blood glucose levels. This occurrence results from a specific tubular lesion impairing glucose reabsorption, rendering renal glycosuria a benign condition. Notably, glycosuria may also manifest in Fanconi syndrome.
Generalized aminoaciduria
Proximal renal tubular dysfunction leads to the excretion of multiple amino acids in urine due to defective tubular reabsorption.
Tubular proteinuria (Low molecular weight proteinuria)
Under normal conditions, low molecular weight proteins, such as β2 –microglobulin, retinol-binding protein, lysozyme, and α1 –microglobulin, undergo filtration by glomeruli and complete reabsorption by proximal renal tubules. Tubular damage disrupts this process, causing the excretion of these proteins in urine, detectable by urine protein electrophoresis. Elevated levels of these proteins in urine indicate renal tubular damage.
Urinary concentration of sodium
When both blood urea nitrogen (BUN) and serum creatinine levels are acutely elevated, distinguishing between prerenal azotemia (renal underperfusion) and acute tubular necrosis becomes essential. In prerenal azotemia, renal tubules function normally, reabsorbing sodium, whereas in acute tubular necrosis, tubular function is impaired, resulting in decreased sodium absorption. Consequently, the urinary sodium concentration is < 20 mEq/L in prerenal azotemia and > 20 mEq/L in acute tubular necrosis.
Fractional excretion of sodium (FENa)
Given that urinary sodium concentration can be influenced by urine volume, calculating the fractional excretion of sodium provides a more accurate assessment. This metric represents the percentage of filtered sodium that has been absorbed and excreted. In cases of acute renal failure, especially in oliguric patients, FENa serves as a reliable means of early differentiation between pre-renal failure and renal failure due to acute tubular necrosis.
The formula for calculating FENa is as follows:
(Urine sodium × Plasma creatinine) ÷ (Plasma sodium × Urine creatinine) × 100%
In pre-renal failure, this ratio is less than 1%, reflecting maximal sodium conservation by tubules stimulated by aldosterone secretion due to reduced renal perfusion. In acute tubular necrosis, the ratio exceeds 1% since tubular cell injury hampers maximum sodium reabsorption. Ratios above 3% strongly suggest acute tubular necrosis.
Tests to Assess Distal Tubular Function
Urine specific gravity
The normal range for urine specific gravity is 1.003 to 1.030, contingent upon the individual's state of hydration and fluid intake.
- Causes of Increased Specific Gravity:
- Reduced renal perfusion (with preservation of tubular concentrating ability),
- Proteinuria,
- Glycosuria,
- Glomerulonephritis,
- Urinary tract obstruction.
- Causes of Reduced Specific Gravity:
- Diabetes insipidus,
- Chronic renal failure,
- Impaired concentrating ability due to tubular diseases.
As a test for renal function, urine specific gravity provides insights into the renal tubules' ability to concentrate the glomerular filtrate. This concentrating capability is compromised in diseases affecting the renal tubules.
A fixed specific gravity of 1.010, impervious to alteration with changes in fluid intake, serves as an indicator of chronic renal failure.
Urine osmolality
The measurement of urine/plasma osmolality stands as the most commonly employed test to assess tubular function. This method, highly sensitive to concentration ability, quantifies the number of dissolved particles in a solution. In contrast, specific gravity, measuring the total mass of solute in relation to water mass, is influenced by the number and nature of dissolved particles, making osmolality a preferred measurement. Osmolality is expressed as milliOsmol/kg of water.
When solutes are dissolved in a solvent, alterations occur in properties such as freezing point, boiling point, vapor pressure, or osmotic pressure. Osmolality measurement, conducted with an instrument known as an osmometer, captures these changes.
The urine/plasma osmolality ratio aids in distinguishing pre-renal azotemia (higher ratio) from acute renal failure due to acute tubular necrosis (lower ratio). Similar urine and plasma osmolality values indicate defective tubular reabsorption of water.
Water deprivation test
When baseline urine osmolality is inconclusive, the water deprivation test is performed. This test involves restricting water intake for a specified period, followed by the measurement of specific gravity or osmolality. In normal cases, urine osmolality should rise in response to water deprivation. Failure to increase prompts administration of desmopressin to differentiate between central and nephrogenic diabetes insipidus. A urine osmolality > 800 mOsm/kg or specific gravity ≥1.025 after dehydration indicates normal renal tubular concentration ability, although normal results do not exclude the presence of renal disease.
Results may be skewed if the patient is on a low-salt, low-protein diet or experiencing major electrolyte and water disturbances.
Water loading antidiuretic hormone suppression test
This test gauges the kidney's ability to dilute urine after water loading. After an overnight fast, the patient drinks 20 ml/kg of water in 15-30 minutes. Urine is collected hourly for 4 hours to measure volume, specific gravity, and osmolality. Plasma antidiuretic hormone levels and serum osmolality are measured at hourly intervals.
Normal results entail excreting over 90% of water in 4 hours, with specific gravity falling to 1.003 and osmolality to < 100 mOsm/kg. Impairments occur in renal function, adrenocortical insufficiency, malabsorption, obesity, ascites, congestive heart failure, cirrhosis, and dehydration. The test is contraindicated in patients with cardiac failure or kidney disease due to the risk of fatal hyponatremia in case of water load failure.
Ammonium chloride loading test (Acid load test)
Utilized in diagnosing distal or type 1 renal tubular acidosis, this test follows exclusion of other causes of metabolic acidosis. After overnight fasting, urine pH and plasma bicarbonate are measured. A pH less than 5.4 with low plasma bicarbonate confirms normal acidifying ability of renal tubules. In cases where neither of these results is obtained, further testing is warranted. The patient receives oral ammonium chloride (0.1 gm/kg) after an overnight fast, and urine samples collected hourly for 6-8 hours. Ammonium ion dissociation produces H+ and NH3, making blood acidic. A pH less than 5.4 in any sample confirms normal acidifying ability of distal tubules.
Microalbuminuria and Albuminuria
Normally, a very small amount of albumin is excreted in urine. The earliest evidence of glomerular damage in diabetes mellitus is occurrence of microalbuminuria (albuminuria in the range of 30 to 300 mg/24 hours). An albuminuria > 300-mg/24 hour is termed clinical or overt and indicates significant glomerular damage.
Microalbuminuria is a term used to describe the presence of small amounts of albumin in the urine. Albumin is a protein that is normally found in the blood, but when it appears in the urine, it can be an early sign of kidney damage. This condition is often associated with diabetes, as high blood sugar levels can damage the blood vessels in the kidneys, leading to the leakage of albumin into the urine. Additionally, microalbuminuria can also be an indicator of other underlying health issues, such as high blood pressure or cardiovascular disease.
On the other hand, albuminuria refers to the presence of larger amounts of albumin in the urine. It is often considered a more severe form of kidney damage compared to microalbuminuria. Albuminuria can be caused by a variety of factors, including diabetes, hypertension, glomerulonephritis, and certain medications. It is crucial to diagnose and monitor albuminuria as it can be a sign of progressive kidney disease and an increased risk of cardiovascular events.
Distinguishing between microalbuminuria and albuminuria is important as they have different diagnostic and clinical implications. Microalbuminuria is often considered an early warning sign of kidney damage, while albuminuria indicates more advanced kidney dysfunction. Identifying these conditions early on allows healthcare professionals to intervene and implement appropriate treatment strategies to prevent further kidney damage and manage associated health conditions.
It is also essential to differentiate albuminuria from proteinuria, another term used to describe the presence of excess protein in the urine. While albumin is a specific type of protein, proteinuria refers to the presence of any type of protein in the urine. Albuminuria is a subset of proteinuria, specifically referring to the presence of albumin. Understanding this distinction is crucial as albuminuria has specific diagnostic and prognostic implications, especially in the context of kidney disease and cardiovascular health.
To measure albuminuria levels, various techniques are available, including urine dipstick tests, spot urine albumin-to-creatinine ratio, and 24-hour urine collection. These methods allow healthcare professionals to quantify the amount of albumin in the urine and determine if it falls within the normal range or if further investigation is required. Abnormal levels of albuminuria can indicate kidney damage and the need for further evaluation and management.
Unraveling Microalbuminuria
Defining Microalbuminuria
Microalbuminuria refers to the presence of small amounts of albumin in the urine. Albumin is a protein that is normally found in the blood, but when it appears in the urine, it can be an early sign of kidney damage or dysfunction. The term "micro" in microalbuminuria signifies that the levels of albumin in the urine are relatively low, but still higher than what is considered normal.
The clinical importance of microalbuminuria lies in its association with various health conditions, particularly diabetes. In fact, microalbuminuria is often considered an early marker of kidney damage in individuals with diabetes. It serves as an indicator of the onset of diabetic nephropathy, a condition characterized by progressive kidney damage due to diabetes.
In addition to diabetes, microalbuminuria can also be seen in other conditions such as hypertension, cardiovascular disease, and certain kidney disorders. It is important to note that microalbuminuria may not always be accompanied by noticeable symptoms, making regular screening and monitoring crucial for early detection and intervention.
By identifying microalbuminuria early on, healthcare professionals can implement appropriate measures to prevent or slow down the progression of kidney damage. This may involve lifestyle modifications, such as maintaining optimal blood sugar and blood pressure levels, as well as medication management.
Furthermore, microalbuminuria can also serve as a prognostic indicator for cardiovascular disease. Studies have shown that individuals with microalbuminuria are at an increased risk of developing heart disease and experiencing cardiovascular events, such as heart attacks and strokes. Therefore, identifying and managing microalbuminuria can have broader implications for overall cardiovascular health.
What is Microalbuminuria?
Microalbuminuria is a term that is frequently used in the medical field, particularly in relation to kidney health. In this section, we will delve deeper into the precise definition of microalbuminuria and explore its clinical importance. By understanding what microalbuminuria is, we can better comprehend its implications and significance in various health conditions.
Microalbuminuria refers to the presence of small amounts of albumin in the urine. Albumin is a protein that is normally found in the blood, but when it appears in the urine, it can be an early sign of kidney damage or dysfunction. The term "micro" in microalbuminuria signifies that the levels of albumin in the urine are relatively low, but still higher than what is considered normal.
The clinical importance of microalbuminuria lies in its association with various health conditions, particularly diabetes. In fact, microalbuminuria is often considered an early marker of kidney damage in individuals with diabetes. It serves as an indicator of the onset of diabetic nephropathy, a condition characterized by progressive kidney damage due to diabetes.
In addition to diabetes, microalbuminuria can also be seen in other conditions such as hypertension, cardiovascular disease, and certain kidney disorders. It is important to note that microalbuminuria may not always be accompanied by noticeable symptoms, making regular screening and monitoring crucial for early detection and intervention.
By identifying microalbuminuria early on, healthcare professionals can implement appropriate measures to prevent or slow down the progression of kidney damage. This may involve lifestyle modifications, such as maintaining optimal blood sugar and blood pressure levels, as well as medication management.
Furthermore, microalbuminuria can also serve as a prognostic indicator for cardiovascular disease. Studies have shown that individuals with microalbuminuria are at an increased risk of developing heart disease and experiencing cardiovascular events, such as heart attacks and strokes. Therefore, identifying and managing microalbuminuria can have broader implications for overall cardiovascular health.
It is worth noting that microalbuminuria is different from proteinuria, which refers to the presence of larger amounts of protein in the urine. While both conditions indicate kidney damage, microalbuminuria specifically refers to the presence of albumin, whereas proteinuria encompasses a broader range of proteins.
Clinical Importance
Microalbuminuria is not just a random occurrence; it holds significant clinical importance in the field of medicine. By understanding the medical implications and relevance of microalbuminuria, healthcare professionals can better assess and manage various health conditions. In this section, we will delve deeper into the clinical importance of microalbuminuria and its implications for patient care.
One of the primary clinical implications of microalbuminuria is its association with kidney damage. As mentioned earlier, the presence of albumin in the urine can be an early sign of kidney dysfunction. In individuals with diabetes, microalbuminuria serves as an early marker of diabetic nephropathy, a condition characterized by progressive kidney damage due to diabetes. By detecting microalbuminuria, healthcare professionals can intervene early and implement measures to slow down the progression of kidney damage.
Moreover, microalbuminuria is not limited to diabetes alone. It can also be seen in individuals with hypertension, cardiovascular disease, and certain kidney disorders. Regular screening for microalbuminuria in these populations is crucial for early detection and intervention. By identifying microalbuminuria in individuals with these conditions, healthcare professionals can implement appropriate measures to prevent or manage kidney damage, ultimately improving patient outcomes.
In addition to its role in assessing kidney health, microalbuminuria also has broader implications for cardiovascular disease. Studies have shown that individuals with microalbuminuria are at an increased risk of developing heart disease and experiencing cardiovascular events, such as heart attacks and strokes. Therefore, identifying and managing microalbuminuria can have significant implications for overall cardiovascular health. By monitoring microalbuminuria levels and implementing appropriate interventions, healthcare professionals can help reduce the risk of cardiovascular complications in at-risk individuals.
Furthermore, microalbuminuria can serve as a prognostic indicator for overall health and well-being. Its presence can indicate underlying systemic inflammation and endothelial dysfunction, both of which are associated with various health conditions. By identifying microalbuminuria, healthcare professionals can further investigate the underlying causes and implement targeted interventions to address these systemic issues. This comprehensive approach to patient care can lead to improved overall health outcomes and a better quality of life for individuals with microalbuminuria.
Microalbuminuria in Diabetes
The Link with Diabetes
Investigating the connection between microalbuminuria and diabetes, it becomes evident that these two conditions are closely intertwined. Diabetes, a chronic metabolic disorder characterized by high blood sugar levels, can have significant implications on kidney health. In fact, microalbuminuria is often considered an early sign of diabetic kidney disease, also known as diabetic nephropathy.
Diabetic nephropathy is a progressive kidney disease that occurs as a result of long-standing diabetes. It is estimated that approximately 30-40% of individuals with diabetes will develop diabetic nephropathy, making it one of the leading causes of end-stage renal disease worldwide. Microalbuminuria serves as a crucial marker in identifying the onset and progression of this condition.
When diabetes is poorly controlled, high levels of glucose in the blood can damage the delicate blood vessels in the kidneys. These blood vessels, known as glomeruli, play a vital role in filtering waste products and excess fluid from the blood. The damage to the glomeruli leads to increased permeability, allowing small amounts of albumin, a protein normally found in the blood, to leak into the urine. This leakage of albumin is what characterizes microalbuminuria.
The presence of microalbuminuria in individuals with diabetes is a red flag, indicating that the kidneys are not functioning optimally. It serves as an early warning sign of potential kidney damage and the progression to more severe forms of kidney disease. Therefore, regular screening for microalbuminuria is recommended for individuals with diabetes to detect kidney dysfunction at an early stage.
Moreover, microalbuminuria is not only a marker of kidney damage but also a predictor of cardiovascular disease in individuals with diabetes. Studies have shown that the presence of microalbuminuria is associated with an increased risk of developing heart disease, stroke, and other cardiovascular complications. This highlights the importance of identifying and managing microalbuminuria in diabetic individuals to prevent the onset of these life-threatening conditions.
The link between microalbuminuria and diabetes is multifactorial. Apart from high blood glucose levels, other factors such as high blood pressure, smoking, and genetic predisposition can further contribute to the development and progression of microalbuminuria in individuals with diabetes. Therefore, it is crucial for healthcare professionals to address these risk factors comprehensively and provide appropriate management strategies to prevent or delay the progression of kidney disease.
Microalbuminuria serves as a crucial link between diabetes and kidney health. It acts as an early indicator of diabetic nephropathy and is associated with an increased risk of cardiovascular disease. Regular screening for microalbuminuria in individuals with diabetes is essential to detect kidney dysfunction at an early stage and implement appropriate interventions to prevent further complications. By understanding the link between microalbuminuria and diabetes, healthcare professionals can take proactive measures to protect the kidney and cardiovascular health of diabetic individuals.
Causes and Mechanisms
Understanding the underlying causes and mechanisms leading to microalbuminuria in diabetic individuals is crucial for effective management and prevention of kidney disease. Several factors contribute to the development of microalbuminuria in diabetes, including:
- Glomerular Damage: The primary cause of microalbuminuria in diabetes is damage to the glomeruli, the tiny blood vessels in the kidneys responsible for filtering waste products. High blood glucose levels, along with other factors such as high blood pressure and inflammation, can lead to the thickening and narrowing of the glomerular walls. This damages the filtration system, allowing albumin to leak into the urine.
- Increased Permeability: In diabetes, the glomerular filtration barrier becomes more permeable, allowing larger molecules like albumin to pass through. This increased permeability is due to the disruption of the podocytes, specialized cells that line the glomerular walls and help maintain the filtration barrier. The loss of podocyte function leads to the leakage of albumin into the urine.
- Oxidative Stress: Diabetes is associated with increased oxidative stress, which occurs when there is an imbalance between the production of harmful free radicals and the body's ability to neutralize them. Oxidative stress can damage the delicate structures of the kidneys, including the glomeruli, leading to microalbuminuria.
- Inflammation: Chronic inflammation plays a significant role in the development and progression of microalbuminuria in diabetes. Inflammatory processes can cause damage to the glomeruli and impair their function, resulting in the leakage of albumin into the urine.
- Endothelial Dysfunction: Diabetes affects the endothelial cells lining the blood vessels, including those in the glomeruli. Endothelial dysfunction leads to impaired regulation of blood flow and increased permeability of the glomerular filtration barrier, contributing to microalbuminuria.
- Renin-Angiotensin System (RAS) Activation: In diabetes, the renin-angiotensin system, which regulates blood pressure and fluid balance, becomes overactive. This activation leads to constriction of the blood vessels in the kidneys and increased production of angiotensin II, a hormone that promotes inflammation and fibrosis. These changes further contribute to glomerular damage and microalbuminuria.
- Genetic Predisposition: Some individuals may have a genetic predisposition to developing microalbuminuria in diabetes. Certain gene variants can affect the structure and function of the glomeruli, making them more susceptible to damage and albumin leakage.
Understanding these underlying causes and mechanisms is essential for targeted interventions to prevent or delay the progression of microalbuminuria in diabetic individuals. By addressing factors such as blood glucose control, blood pressure management, and inflammation reduction, healthcare professionals can help minimize glomerular damage and preserve kidney function.
In addition to lifestyle modifications, medications that target the renin-angiotensin system, such as angiotensin-converting enzyme inhibitors (ACE inhibitors) and angiotensin receptor blockers (ARBs), are commonly prescribed to individuals with microalbuminuria. These medications help reduce blood pressure, protect the glomeruli, and slow the progression of kidney disease.
Microalbuminuria in diabetes is caused by a combination of glomerular damage, increased permeability, oxidative stress, inflammation, endothelial dysfunction, RAS activation, and genetic predisposition. Understanding these causes and mechanisms is crucial for implementing effective strategies to prevent and manage microalbuminuria in diabetic individuals. By addressing these underlying factors, healthcare professionals can help preserve kidney function and reduce the risk of complications associated with microalbuminuria and diabetic kidney disease.
Deciphering Albuminuria
Defining Albuminuria
Albuminuria is a term that is often used in the medical field, particularly in relation to kidney health. In this section, we will delve deeper into the definition of albuminuria and explore its implications. By understanding what albuminuria is, we can gain valuable insights into its clinical significance and diagnostic value.
Albuminuria refers to the presence of albumin in the urine. Albumin is a protein that is normally found in the blood, but when it appears in the urine, it can be an indication of kidney damage or dysfunction. The kidneys play a crucial role in filtering waste products from the blood and maintaining the balance of fluids and electrolytes in the body. When the kidneys are functioning properly, they prevent the passage of albumin into the urine. However, when there is damage to the kidneys, the filtration process is compromised, leading to the leakage of albumin into the urine.
The presence of albumin in the urine can be an early sign of kidney disease or other underlying health conditions. It is important to note that albuminuria is not a disease itself, but rather a marker of kidney damage. By detecting albuminuria, healthcare professionals can identify individuals who may be at risk of developing kidney disease or who may already have kidney damage.
Distinguishing albuminuria from microalbuminuria is essential. While both terms refer to the presence of albumin in the urine, microalbuminuria specifically refers to a lower level of albumin in the urine. Microalbuminuria is often used as an early marker for kidney damage, particularly in individuals with diabetes. On the other hand, albuminuria generally indicates more significant kidney damage or dysfunction.
Understanding the medical terminology associated with albuminuria is crucial for accurate diagnosis and communication between healthcare professionals. By using standardized terminology, healthcare providers can ensure consistency in their assessments and interpretations of albuminuria. This allows for better collaboration and understanding among medical professionals, ultimately leading to improved patient care.
The diagnostic significance of albuminuria cannot be overstated. It serves as an important tool for identifying individuals at risk of kidney disease and monitoring the progression of existing kidney conditions. By measuring albuminuria levels, healthcare professionals can assess the severity of kidney damage and determine appropriate treatment plans. Additionally, albuminuria can also be an indicator of other health conditions, such as cardiovascular disease, hypertension, and diabetes.
Albuminuria is the presence of albumin in the urine and serves as a marker of kidney damage or dysfunction. It is important to differentiate between albuminuria and microalbuminuria, as they indicate different levels of albumin in the urine. Understanding the medical terminology associated with albuminuria is crucial for accurate diagnosis and effective communication among healthcare professionals. The diagnostic significance of albuminuria cannot be overlooked, as it provides valuable insights into kidney health and the presence of other underlying health conditions.
What is Albuminuria?
Albuminuria is a term that is frequently used in the medical field, particularly in relation to kidney health. It refers to the presence of albumin in the urine, which can be an indication of kidney damage or dysfunction. Albumin, a protein normally found in the blood, should not be present in the urine under normal circumstances. When albumin appears in the urine, it suggests that the kidneys are not functioning properly and are allowing the leakage of this protein.
Understanding what albuminuria is can provide valuable insights into its clinical significance and diagnostic value. While albuminuria itself is not a disease, it serves as a marker of kidney damage or dysfunction. By detecting albuminuria, healthcare professionals can identify individuals who may be at risk of developing kidney disease or who may already have kidney damage.
Distinguishing albuminuria from microalbuminuria is essential. Both terms refer to the presence of albumin in the urine, but microalbuminuria specifically refers to a lower level of albumin in the urine. Microalbuminuria is often used as an early marker for kidney damage, particularly in individuals with diabetes. On the other hand, albuminuria generally indicates more significant kidney damage or dysfunction.
The medical terminology associated with albuminuria is crucial for accurate diagnosis and effective communication among healthcare professionals. By using standardized terminology, healthcare providers can ensure consistency in their assessments and interpretations of albuminuria. This allows for better collaboration and understanding among medical professionals, ultimately leading to improved patient care.
The diagnostic significance of albuminuria cannot be overstated. It serves as an important tool for identifying individuals at risk of kidney disease and monitoring the progression of existing kidney conditions. By measuring albuminuria levels, healthcare professionals can assess the severity of kidney damage and determine appropriate treatment plans. Additionally, albuminuria can also be an indicator of other health conditions, such as cardiovascular disease, hypertension, and diabetes.
Albuminuria is the presence of albumin in the urine and serves as a marker of kidney damage or dysfunction. Distinguishing albuminuria from microalbuminuria is crucial, as they indicate different levels of albumin in the urine. Understanding the medical terminology associated with albuminuria is essential for accurate diagnosis and effective communication among healthcare professionals. The diagnostic significance of albuminuria cannot be overlooked, as it provides valuable insights into kidney health and the presence of other underlying health conditions. By detecting albuminuria, healthcare professionals can identify individuals at risk and take appropriate measures to prevent further kidney damage or manage existing conditions.
Distinguishing Albuminuria from Microalbuminuria
When it comes to understanding kidney health, it is important to differentiate between albuminuria and microalbuminuria. While both terms refer to the presence of albumin in the urine, there are key differences that set them apart. Let's explore these differences and understand why they are significant.
Albuminuria, as we discussed earlier, is the presence of albumin in the urine. It is an indication of kidney damage or dysfunction and suggests that the kidneys are not functioning properly. On the other hand, microalbuminuria specifically refers to a lower level of albumin in the urine. It is often used as an early marker for kidney damage, particularly in individuals with diabetes.
One of the main differences between albuminuria and microalbuminuria is the level of albumin present in the urine. Microalbuminuria is characterized by a relatively low level of albumin, usually between 30-300 mg per day. This lower level of albumin can be detected through specialized tests that are more sensitive to small amounts of albumin in the urine.
Albuminuria, on the other hand, generally indicates more significant kidney damage or dysfunction. The level of albumin in the urine is usually higher, exceeding 300 mg per day. This higher level of albumin suggests that the kidneys are experiencing more severe impairment and are unable to properly filter out the protein.
Another important distinction between albuminuria and microalbuminuria is their clinical significance. Microalbuminuria is often used as an early marker for kidney damage, particularly in individuals with diabetes. It can serve as a warning sign that the kidneys are not functioning optimally and that further damage may occur if appropriate measures are not taken.
Albuminuria, on the other hand, generally indicates more advanced kidney damage or dysfunction. It is associated with a higher risk of developing kidney disease and other complications. Detecting albuminuria is crucial for healthcare professionals to identify individuals who may require more intensive monitoring and treatment to prevent further kidney damage.
In terms of diagnostic value, both albuminuria and microalbuminuria play important roles. By measuring albuminuria levels, healthcare professionals can assess the severity of kidney damage and determine appropriate treatment plans. Microalbuminuria, in particular, can help identify individuals who may benefit from early interventions to prevent the progression of kidney disease.
It is worth noting that albuminuria can also be an indicator of other health conditions, such as cardiovascular disease, hypertension, and diabetes. Therefore, detecting albuminuria can provide valuable insights into a patient's overall health and help healthcare professionals identify and manage these underlying conditions.
Distinguishing between albuminuria and microalbuminuria is crucial for understanding kidney health and identifying individuals at risk of kidney disease. While both terms refer to the presence of albumin in the urine, microalbuminuria specifically indicates a lower level of albumin and serves as an early marker for kidney damage. Albuminuria, on the other hand, generally indicates more significant kidney damage or dysfunction. By detecting and monitoring albuminuria levels, healthcare professionals can assess the severity of kidney damage, identify underlying health conditions, and determine appropriate treatment plans.
Clinical Albuminuria
Medical Terminology
Examining albuminuria as a medical term and its application in clinical settings, it is important to understand the significance of this condition in diagnosing and managing various health conditions. Albuminuria refers to the presence of excessive amounts of albumin, a protein, in the urine. This condition is often an indicator of kidney damage or dysfunction.
Albuminuria is a term commonly used by healthcare professionals to describe the presence of albumin in the urine. It is an important diagnostic marker for kidney diseases, particularly those affecting the glomeruli, the tiny blood vessels in the kidneys responsible for filtering waste products from the blood. When the glomeruli are damaged, they may allow albumin to leak into the urine, leading to albuminuria.
The presence of albuminuria can be an early sign of kidney damage, even before other symptoms become apparent. It is often associated with conditions such as diabetes, hypertension, and chronic kidney disease. Monitoring albuminuria levels can help healthcare providers assess the progression of these conditions and make informed decisions regarding treatment and management.
In clinical settings, albuminuria is measured using various methods, including urine dipstick tests and laboratory analysis. These tests detect the presence of albumin in the urine and provide an indication of the severity of albuminuria. Normal levels of albumin in the urine are typically less than 30 milligrams per gram of creatinine (mg/g). Higher levels may indicate kidney damage or dysfunction.
The diagnostic significance of albuminuria lies in its ability to identify individuals at risk of developing kidney disease or those who already have kidney damage. It serves as a valuable tool for healthcare providers to assess kidney function and determine the appropriate course of action. By monitoring albuminuria levels over time, healthcare professionals can track the progression of kidney disease and make necessary adjustments to treatment plans.
Furthermore, albuminuria can also be used to assess the effectiveness of interventions aimed at reducing kidney damage. For example, in individuals with diabetes, tight control of blood glucose levels and blood pressure can help prevent or delay the onset of kidney disease. Regular monitoring of albuminuria levels can provide valuable feedback on the success of these interventions and guide further treatment decisions.
Diagnostic Significance
Albuminuria plays a crucial role in medical assessments as it holds significant diagnostic value. By detecting the presence of excessive amounts of albumin in the urine, healthcare professionals can gain valuable insights into the underlying health conditions and make informed decisions regarding treatment and management. This section will delve into the diagnostic significance of albuminuria and its implications in clinical practice.
One of the primary uses of albuminuria as a diagnostic marker is in identifying individuals at risk of developing kidney disease or those who already have kidney damage. As mentioned earlier, albuminuria is often associated with conditions such as diabetes, hypertension, and chronic kidney disease. Monitoring albuminuria levels can help healthcare providers assess the progression of these conditions and determine the appropriate course of action. By identifying albuminuria early on, interventions can be implemented to prevent or delay the onset of kidney disease, leading to improved patient outcomes.
In addition to kidney disease, albuminuria can also serve as an indicator of other systemic conditions. For example, it has been found that albuminuria is associated with cardiovascular disease. Studies have shown that individuals with albuminuria are at a higher risk of developing heart disease, stroke, and other cardiovascular events. Therefore, by monitoring albuminuria levels, healthcare professionals can identify individuals who may benefit from further cardiovascular assessments and interventions.
Furthermore, albuminuria can provide valuable information about the effectiveness of interventions aimed at reducing kidney damage and improving overall health. For instance, in individuals with diabetes, tight control of blood glucose levels and blood pressure can help prevent or delay the onset of kidney disease. Regular monitoring of albuminuria levels can serve as a feedback mechanism to assess the success of these interventions. If albuminuria levels decrease over time, it indicates that the interventions are effective in preserving kidney function and reducing the risk of complications.
Another diagnostic significance of albuminuria lies in its ability to differentiate between different types of kidney diseases. While albuminuria is primarily associated with glomerular damage, proteinuria, which refers to the presence of excessive amounts of protein in the urine, can be indicative of tubular damage. By distinguishing between albuminuria and proteinuria, healthcare professionals can narrow down the potential causes of kidney dysfunction and tailor treatment plans accordingly.
Albuminuria holds significant diagnostic significance in medical assessments. By monitoring albuminuria levels, healthcare professionals can identify individuals at risk of developing kidney disease, assess the progression of existing conditions, and make informed decisions regarding treatment and management. Additionally, albuminuria can serve as an indicator of other systemic conditions, such as cardiovascular disease. Furthermore, albuminuria can provide valuable information about the effectiveness of interventions aimed at reducing kidney damage. By understanding the diagnostic significance of albuminuria, healthcare professionals can utilize this information to improve patient outcomes and tailor treatment plans for optimal results.
Comparative Analysis
Albuminuria vs Proteinuria
Differentiating Albuminuria and Proteinuria
Albuminuria and proteinuria are two terms often used interchangeably, but they actually refer to different conditions. In this section, we will delve into the distinctions between albuminuria and proteinuria, shedding light on their differences and clinical implications.
Albuminuria, as we discussed earlier, is the presence of albumin in the urine. It is a specific type of proteinuria, where the protein being excreted is primarily albumin. On the other hand, proteinuria refers to the presence of any type of protein in the urine, not just albumin. While albumin is the most common protein found in urine, proteinuria can also include other proteins such as globulins and enzymes.
One key difference between albuminuria and proteinuria lies in their diagnostic significance. Albuminuria is often considered an early sign of kidney damage, particularly in the context of diabetes. It is a sensitive marker for detecting early kidney dysfunction and can be an indicator of increased cardiovascular risk. On the other hand, proteinuria, especially when it involves other proteins besides albumin, may indicate more severe kidney damage or underlying systemic conditions.
Another important distinction is the measurement techniques used to assess albuminuria and proteinuria levels. Albuminuria is typically measured using a urine albumin-to-creatinine ratio (ACR) or a spot urine albumin test. These tests provide a quantitative assessment of the amount of albumin present in the urine. Proteinuria, on the other hand, is often measured using a 24-hour urine collection or a spot urine protein test. These tests provide a broader assessment of all types of proteins present in the urine.
Clinical implications also differ between albuminuria and proteinuria. Albuminuria, particularly in the context of diabetes, is associated with an increased risk of developing kidney disease and cardiovascular complications. It is an important marker for monitoring the progression of kidney disease and guiding treatment decisions. Proteinuria, especially when it involves other proteins besides albumin, may indicate more severe kidney damage and can be a sign of underlying systemic conditions such as autoimmune diseases or infections.
In summary, while albuminuria and proteinuria are related terms, they have distinct differences. Albuminuria specifically refers to the presence of albumin in the urine and is often considered an early sign of kidney damage, particularly in diabetes. Proteinuria, on the other hand, encompasses the presence of any type of protein in the urine and may indicate more severe kidney damage or underlying systemic conditions. The measurement techniques, diagnostic significance, and clinical implications of albuminuria and proteinuria also vary. Understanding these differences is crucial for accurate diagnosis and appropriate management of kidney-related conditions.
Clinical Implications
Understanding the clinical significance of distinguishing between albuminuria and proteinuria is crucial for accurate diagnosis and appropriate management of kidney-related conditions. While these terms are often used interchangeably, they have distinct differences that impact their diagnostic value and treatment implications.
Albuminuria, as we discussed earlier, refers specifically to the presence of albumin in the urine. It is a sensitive marker for detecting early kidney dysfunction, particularly in the context of diabetes. The measurement of albuminuria levels, usually done through a urine albumin-to-creatinine ratio (ACR) or a spot urine albumin test, provides a quantitative assessment of the amount of albumin excreted in the urine. This information is valuable in monitoring the progression of kidney disease and guiding treatment decisions.
The clinical implications of albuminuria extend beyond kidney health. Research has shown that albuminuria is associated with an increased risk of developing cardiovascular complications. It serves as an important marker for identifying individuals at higher risk of heart disease and stroke. By detecting albuminuria early on, healthcare providers can implement interventions to reduce cardiovascular risk factors and improve patient outcomes.
On the other hand, proteinuria encompasses the presence of any type of protein in the urine, not just albumin. While albumin is the most common protein found in urine, proteinuria can also include other proteins such as globulins and enzymes. The measurement of proteinuria levels, often done through a 24-hour urine collection or a spot urine protein test, provides a broader assessment of all types of proteins present in the urine.
The presence of proteinuria, especially when it involves proteins other than albumin, may indicate more severe kidney damage or underlying systemic conditions. It can be a sign of advanced kidney disease or other health issues such as autoimmune diseases or infections. Identifying proteinuria and determining its underlying cause is essential for appropriate management and treatment planning.
Differentiating between albuminuria and proteinuria is not only important for diagnostic purposes but also for monitoring treatment response. For example, in individuals with diabetes, reducing albuminuria levels is a key treatment goal. By closely monitoring albuminuria levels over time, healthcare providers can assess the effectiveness of interventions such as blood pressure control, glucose management, and medication adjustments.
Moreover, the distinction between albuminuria and proteinuria has implications for research and clinical trials. Studies focusing on albuminuria as an endpoint can provide valuable insights into the efficacy of interventions in preventing or slowing the progression of kidney disease. By specifically targeting albuminuria reduction, researchers can evaluate the impact of interventions on kidney health and cardiovascular outcomes.
Quantifying Albuminuria Levels
Measurement Techniques
Methods for Assessing Albuminuria Levels
Assessing albuminuria levels is crucial in diagnosing and monitoring kidney function. Various techniques are employed to accurately measure albuminuria, providing valuable insights into the health of the kidneys. In this section, we will delve into the different methods used to assess albuminuria levels and their significance in clinical practice.
One commonly used method for assessing albuminuria levels is the urine albumin-to-creatinine ratio (UACR). This test measures the amount of albumin in the urine relative to the amount of creatinine, a waste product produced by the muscles. The UACR is a simple and convenient test that can be performed on a random urine sample. It is widely used in clinical settings due to its accuracy and reliability in detecting albuminuria.
Another method used to assess albuminuria levels is the 24-hour urine collection. This method involves collecting all urine produced over a 24-hour period and measuring the amount of albumin present. The 24-hour urine collection provides a more accurate assessment of albuminuria levels as it takes into account the variations in urine production throughout the day. However, this method can be cumbersome for patients and may lead to incomplete or inaccurate collections.
In addition to these methods, there are also semi-quantitative tests available for assessing albuminuria levels. These tests, such as the dipstick test, provide a qualitative assessment of albuminuria by detecting the presence or absence of albumin in the urine. While these tests are less precise than quantitative methods, they can still be useful in screening for albuminuria in certain situations.
It is important to note that albuminuria levels can vary throughout the day and may be influenced by factors such as physical activity, diet, and medication. Therefore, it is recommended to perform multiple measurements over time to obtain a more accurate assessment of albuminuria levels. This longitudinal approach helps to account for any fluctuations and provides a clearer picture of kidney function.
The interpretation of albuminuria levels depends on the specific method used for assessment. Generally, albuminuria levels are classified into three categories: normal, microalbuminuria, and macroalbuminuria. Normal levels indicate that the kidneys are functioning properly, while microalbuminuria and macroalbuminuria indicate varying degrees of kidney damage. Microalbuminuria refers to a slightly elevated level of albumin in the urine, which can be an early sign of kidney dysfunction. Macroalbuminuria, on the other hand, indicates a significant increase in albumin levels and is often associated with more advanced kidney disease.
Assessing albuminuria levels is essential for evaluating kidney function. The urine albumin-to-creatinine ratio, 24-hour urine collection, and semi-quantitative tests are commonly used methods for measuring albuminuria. Each method has its advantages and limitations, and multiple measurements over time are recommended for a more accurate assessment. Understanding albuminuria levels helps healthcare professionals diagnose and monitor kidney disease, enabling timely intervention and management.
Normal vs Abnormal Levels
When assessing albuminuria levels, it is important to establish the parameters that determine whether the levels are within the normal range or indicate abnormal kidney function. By understanding these parameters, healthcare professionals can accurately diagnose and monitor kidney disease. In this section, we will explore the criteria used to classify albuminuria levels as normal or abnormal.
The classification of albuminuria levels is primarily based on the amount of albumin present in the urine. Normal levels of albumin in the urine indicate that the kidneys are functioning properly and there is no evidence of kidney damage. On the other hand, abnormal levels of albumin in the urine suggest varying degrees of kidney dysfunction.
Microalbuminuria is a term used to describe slightly elevated levels of albumin in the urine. It is considered an early sign of kidney dysfunction and can be an indicator of early-stage kidney disease. The threshold for diagnosing microalbuminuria varies depending on the method used for assessment. The urine albumin-to-creatinine ratio (UACR) is commonly used to determine microalbuminuria levels. Generally, a UACR between 30-300 mg/g is considered indicative of microalbuminuria. However, it is important to note that different guidelines may have slightly different thresholds for diagnosis.
Macroalbuminuria, also known as overt albuminuria, refers to a significant increase in albumin levels in the urine. It is often associated with more advanced kidney disease and indicates a higher degree of kidney damage. The threshold for diagnosing macroalbuminuria is typically a UACR greater than 300 mg/g. At this level, the kidneys are not effectively filtering waste products, including albumin, leading to its accumulation in the urine.
It is worth mentioning that the classification of albuminuria levels is not solely based on the UACR. Other factors, such as the presence of other symptoms, medical history, and the results of additional tests, are also taken into consideration when determining the severity of kidney disease. These factors help healthcare professionals make a comprehensive assessment and develop an appropriate treatment plan.
In addition to the UACR, the 24-hour urine collection method is another way to assess albuminuria levels. Normal levels of albumin in a 24-hour urine collection are typically less than 30 mg. Levels between 30-300 mg are considered indicative of microalbuminuria, while levels greater than 300 mg suggest macroalbuminuria.
It is important to note that albuminuria levels can fluctuate throughout the day and may be influenced by various factors such as physical activity, diet, and medication. Therefore, it is recommended to perform multiple measurements over time to obtain a more accurate assessment of albuminuria levels. This longitudinal approach helps to account for any variations and provides a clearer picture of kidney function.
The classification of albuminuria levels as normal or abnormal is based on the amount of albumin present in the urine. Microalbuminuria refers to slightly elevated levels of albumin and is considered an early sign of kidney dysfunction. Macroalbuminuria indicates a significant increase in albumin levels and is associated with more advanced kidney disease. The UACR and 24-hour urine collection are commonly used methods to assess albuminuria levels. Multiple measurements over time are recommended to obtain a more accurate assessment. Understanding the classification of albuminuria levels helps healthcare professionals diagnose and monitor kidney disease, enabling timely intervention and management.
Summary
Throughout this article, we have explored the concepts of microalbuminuria and albuminuria, delving into their definitions, clinical significance, and diagnostic criteria. By understanding these terms and their implications, healthcare professionals can effectively diagnose and monitor kidney disease, enabling timely intervention and management.
Microalbuminuria is characterized by slightly elevated levels of albumin in the urine. It serves as an early sign of kidney dysfunction and can be an indicator of early-stage kidney disease. The urine albumin-to-creatinine ratio (UACR) is commonly used to determine microalbuminuria levels, with a UACR between 30-300 mg/g considered indicative of this condition. However, it is important to note that different guidelines may have slightly different thresholds for diagnosis.
On the other hand, macroalbuminuria, also known as overt albuminuria, refers to a significant increase in albumin levels in the urine. It is often associated with more advanced kidney disease and indicates a higher degree of kidney damage. A UACR greater than 300 mg/g is typically used to diagnose macroalbuminuria. At this level, the kidneys are not effectively filtering waste products, including albumin, leading to its accumulation in the urine.
It is worth mentioning that the classification of albuminuria levels is not solely based on the UACR. Other factors, such as the presence of other symptoms, medical history, and the results of additional tests, are also taken into consideration when determining the severity of kidney disease. This comprehensive assessment helps healthcare professionals develop an appropriate treatment plan tailored to the individual patient.
In addition to the UACR, the 24-hour urine collection method is another way to assess albuminuria levels. Normal levels of albumin in a 24-hour urine collection are typically less than 30 mg. Levels between 30-300 mg are considered indicative of microalbuminuria, while levels greater than 300 mg suggest macroalbuminuria. However, it is important to note that albuminuria levels can fluctuate throughout the day and may be influenced by various factors such as physical activity, diet, and medication. Therefore, performing multiple measurements over time is recommended to obtain a more accurate assessment of albuminuria levels.
In conclusion, microalbuminuria and albuminuria are important indicators of kidney function and can provide valuable insights into the presence and progression of kidney disease. Microalbuminuria serves as an early warning sign, while macroalbuminuria indicates more advanced kidney damage. The UACR and 24-hour urine collection are commonly used methods to assess albuminuria levels, but a comprehensive evaluation that considers other factors is necessary for an accurate diagnosis. By understanding the classification of albuminuria levels and utilizing appropriate diagnostic tools, healthcare professionals can effectively manage and treat kidney disease, improving patient outcomes and quality of life.
Biochemical Tests Used to Assess Renal Function

Renal function is often evaluated using two primary biochemical parameters: blood urea nitrogen (BUN) and serum creatinine. Despite their convenience, these markers prove to be less sensitive indicators of glomerular function.
Blood Urea Nitrogen (BUN)
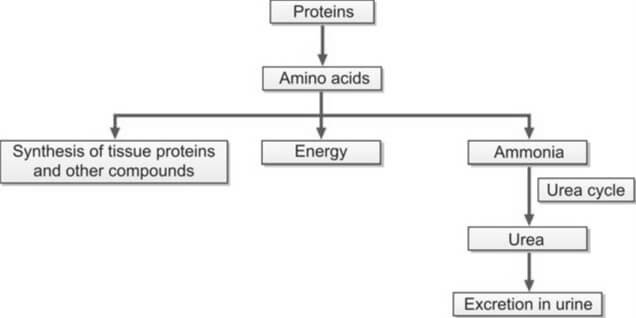
Urea originates in the liver through the conversion of amino acids, whether derived from ingested sources or tissues. Amino acids play a crucial role in energy production, protein synthesis, and are subject to catabolism, leading to the formation of ammonia. The liver, in the Krebs urea cycle, transforms this ammonia into urea. Given the toxicity of ammonia, its conversion to urea ensures safe elimination through urine excretion (refer to Figure 1).
The concentration of blood urea is commonly expressed as blood urea nitrogen (BUN), a practice rooted in older methods that exclusively assessed the nitrogen content in urea. With urea's molecular weight being 60, a gram mole of urea contains 28 grams of nitrogen. This relationship, expressed as 60/28, allows the conversion of BUN to urea by multiplying BUN by 2.14, thereby establishing the real concentration of urea as BUN × (60/28).
Glomeruli completely filter urea, and depending on an individual's hydration status, approximately 30-40% of the filtered amount is reabsorbed in the renal tubules.
The blood level of urea is susceptible to various non-renal factors, such as a high-protein diet, upper gastrointestinal hemorrhage, and liver function. Consequently, the utility of BUN as a reliable indicator of renal function is limited. Significant destruction of renal parenchyma is necessary before an elevation in blood urea can be observed.
Azotemia refers to an increase in the blood level of urea, while uremia represents the clinical syndrome resulting from this elevation. In the absence of renal function, BUN experiences a daily rise of 10-20 mg/dl.
Causes of increased BUN
- Pre-renal Azotemia: Conditions such as shock, congestive heart failure, and salt and water depletion
- Renal Azotemia: Impairment of renal function
- Post-renal Azotemia: Obstruction of the urinary tract
- Increased Rate of Urea Production:
- Adoption of a high-protein diet
- Elevated protein catabolism due to factors such as trauma, burns, or fever
- Absorption of amino acids and peptides resulting from significant gastrointestinal hemorrhage or tissue hematoma
Methods for estimation of BUN
Two methods are commonly used.
- Diacetyl Monoxime Urea Method: A direct approach involving the reaction of urea with diacetyl monoxime at high temperatures, facilitated by a strong acid and an oxidizing agent. This reaction yields a yellow diazine derivative, and the color intensity is quantified using a colorimeter or spectrophotometer.
- Urease-Berthelot Reaction: An indirect method where the enzyme urease catalyzes the separation of ammonia from the urea molecule at 37°C. The resulting ammonia is then reacted with alkaline hypochlorite and phenol in the presence of a catalyst, producing a stable color known as indophenol. The intensity of the color produced is subsequently measured at 570 nm using a spectrophotometer.
The established reference range for Blood Urea Nitrogen (BUN) in adults spans from 7 to 18 mg/dl. However, for individuals aged over 60 years, the acceptable range extends slightly, ranging from 8 to 21 mg/dl.
Serum Creatinine
Creatinine, a nitrogenous waste product, originates in muscle through the conversion of creatine phosphate. Its endogenous production correlates with muscle mass and body weight, with exogenous creatinine from meat ingestion exerting minimal influence on daily creatinine excretion.
When compared to Blood Urea Nitrogen (BUN), serum creatinine emerges as a more specific and sensitive indicator of renal function for several reasons:
- Creatinine is consistently produced by muscles at a steady rate, remaining unaffected by dietary variations, protein catabolism, or other external factors.
- Unlike BUN, creatinine is not reabsorbed, and only a minimal amount is secreted by the renal tubules.
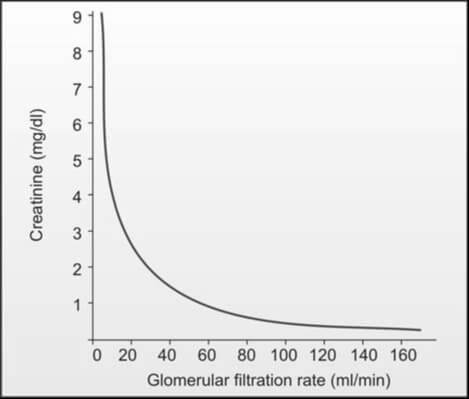
While an increased creatinine level reflects a reduction in glomerular filtration rate when muscle mass is constant, the manifestation of elevated serum creatinine levels (e.g., from 1.0 mg/dl to 2.0 mg/dl) in blood is delayed until about 50% of kidney function is lost, owing to significant kidney reserve. Consequently, serum creatinine proves less sensitive in detecting early renal impairment. It's important to note that a laboratory report indicating serum creatinine within the normal range does not necessarily denote normalcy; the level should be correlated with the individual's body weight, age, and sex. In the absence of renal function, serum creatinine rises by 1.0 to 1.5 mg/dl per day (refer to Figure 2).
Causes of Increased Serum Creatinine Level
- Pre-renal, renal, and post-renal azotemia
- High intake of dietary meat
- Presence of active acromegaly and gigantism
Causes of Decreased Serum Creatinine Level
- Pregnancy
- Increasing age (reduction in muscle mass)
Methods for Estimation of Serum Creatinine
The assay for serum creatinine stands out for its cost-effectiveness, widespread availability, and simplicity in execution. Two commonly employed methods are as follows:
- Jaffe’s Reaction (Alkaline Picrate Reaction): This method holds prominence as the most widely used. In an alkaline solution, creatinine reacts with picrate, yielding a spectrophotometric response at 485 nm. Notably, certain plasma components like glucose, protein, fructose, ascorbic acid, acetoacetate, acetone, and cephalosporins exhibit a similar reaction with picrate, collectively termed non-creatinine chromogens. Their interaction can lead to a false elevation of serum creatinine levels, resulting in a 'true' creatinine value that is understated by 0.2 to 0.4 mg/dl when assessed through Jaffe’s reaction.
- Enzymatic Methods: This alternative approach employs enzymes that catalyze the cleavage of creatinine. Subsequent to the production of hydrogen peroxide, its reaction with phenol and a dye generates a colored product, measurable through spectrophotometry.
Reference Range
- Adult males: 0.7-1.3 mg/dl
- Adult females: 0.6-1.1 mg/dl
Relying solely on serum creatinine for the evaluation of renal function is not recommended. The concentration of serum creatinine is influenced by factors such as age, sex, muscle mass, glomerular filtration, and the extent of tubular secretion. Consequently, the normal range for serum creatinine is broad. The elevation of serum creatinine becomes apparent when the glomerular filtration rate (GFR) falls below 50% of the normal level. Even a minor increase in serum creatinine is indicative of a significant reduction in GFR, as illustrated in Figure 2. Consequently, the early stages of chronic renal impairment cannot be effectively identified through the measurement of serum creatinine alone.
BUN/Serum Creatinine Ratio
Clinicians commonly calculate BUN/creatinine ratio as a diagnostic tool to differentiate pre-renal and post-renal azotemia from renal azotemia. The standard range for this ratio is 12:1 to 20:1.
Causes of Increased BUN/Creatinine Ratio (>20:1):
- Elevated BUN with normal serum creatinine:
- Pre-renal azotemia (resulting from reduced renal perfusion)
- High protein diet
- Increased protein catabolism
- Gastrointestinal hemorrhage
- Elevation of both BUN and serum creatinine with a disproportionately greater increase in BUN:
- Post-renal azotemia (caused by obstruction to urine outflow)
- Obstruction to urinary outflow induces the diffusion of urinary urea back into the bloodstream from tubules due to increased backpressure.
Causes of Decreased BUN/Creatinine Ratio (<10:1)
- Acute tubular necrosis
- Low protein diet and starvation
- Severe liver disease
Clearance Tests to Measure Glomerular Filtration Rate (GFR)

Glomerular filtration rate (GFR) represents the rate in ml/min at which a substance is effectively cleared from the bloodstream by the glomeruli. The evaluative measure of the glomeruli's ability to filter a substance from the blood is conducted through clearance studies. If a substance is unbound to plasma proteins, undergoes complete filtration by the glomeruli, and experiences neither tubular secretion nor reabsorption, its clearance rate aligns with the glomerular filtration rate.
The clearance of a substance denotes the volume of plasma entirely purged of that substance per minute, calculated using the formula:
Clearance = UV⁄P
Here, U signifies the concentration of the substance in urine in mg/dl; V denotes the volume of excreted urine in ml/min; and P represents the concentration of the substance in plasma in mg/dl. Given that U and P share the same units, they mutually nullify, rendering the clearance value expressed in the same unit as V, i.e., ml/min. All clearance values are standardized to a standard body surface area of 1.73 m2.
The substances employed for gauging glomerular filtration rate (GFR) encompass:
- Exogenous: Inulin, Radiolabelled ethylenediamine tetraacetic acid (51Cr- EDTA), 125I-iothalamate
- Endogenous: Creatinine, Urea, Cystatin C
The selected agent for GFR measurement should exhibit the following properties: (1) Physiological inertness, preferably endogenous nature, (2) Unrestricted filtration by glomeruli without reabsorption or secretion by renal tubules, (3) No binding to plasma proteins and resistance to renal metabolism, and (4) Sole excretion by the kidneys. However, an entirely ideal endogenous agent remains elusive.
Conducting clearance tests proves to be intricate, costly, and not readily accessible. A significant challenge in clearance studies lies in the potential for incomplete urine collection.
Anomalous clearance patterns manifest in: (i) pre-renal factors such as diminished blood flow due to shock, dehydration, and congestive cardiac failure; (ii) renal diseases; and (iii) obstruction in urinary outflow.
Inulin Clearance
Inulin, an inert plant polysaccharide (a fructose polymer), undergoes glomerular filtration without reabsorption or secretion by the renal tubules, rendering it an ideal agent for GFR measurement. The procedure involves administering a bolus dose of inulin (25 ml of 10% solution IV), followed by a constant intravenous infusion (500 ml of 1.5% solution at a rate of 4 ml/min). Timed urine samples are collected, and blood samples are obtained at the midpoint of the timed urine collection. Widely recognized as the 'gold standard' or reference method for GFR estimation, this test is seldom employed due to its time-consuming nature, high cost, the requirement for continuous intravenous inulin infusion to maintain a steady plasma level, and challenges in laboratory analysis. The average inulin clearance is 125 ml/min/1.73 m2 for males and 110 ml/min/1.73 m2 for females. Clearance tends to be lower in children under 2 years and older adults. Primarily reserved for clinical research, this test is not commonly utilized in routine clinical practice.
Clearance of Radiolabeled Agents
Urinary clearance of radiolabeled iothalamate (125Iiothalamate) exhibits a close correlation with inulin clearance. Nevertheless, this technique is associated with high costs and potential exposure to radioactive substances. Alternative radiolabeled substances employed for similar purposes include 51Cr-EDTA and 99Tc-DTPA.
Cystatin C Clearance
Cystatin C, a cysteine protease inhibitor with a molecular weight of 13,000, is consistently synthesized by all nucleated cells at a constant rate. Unbound to proteins, it undergoes free filtration by glomeruli and is not reabsorbed into circulation post-filtration. Demonstrating greater sensitivity and specificity for impaired renal function than plasma creatinine, cystatin C serves as a marker unaffected by factors like sex, diet, or muscle mass. Many consider cystatin C superior to creatinine clearance as an estimator of GFR. Its measurement is typically conducted through immunoassay techniques.
Creatinine Clearance
The most widely employed method for assessing GFR is through creatinine clearance testing.
Creatinine, a continuous byproduct of muscle creatine, undergoes complete filtration by glomeruli and experiences negligible reabsorption by tubules, with a minor portion being tubularly secreted.
A 24-hour urine sample is the preferred collection method, mitigating issues related to diurnal variations in creatinine excretion and enhancing collection accuracy.
The procedure involves discarding the initial morning void and subsequently collecting all subsequent urine in the provided container. The next morning, the first voided urine is also collected, and the container is submitted to the laboratory. Simultaneously, a blood sample is drawn at the midpoint of the urine collection period to estimate plasma creatinine levels. Creatinine clearance is calculated using the following parameters: (1) creatinine concentration in urine in mg/ml (U), (2) volume of urine excreted in ml/min (V) – calculated as the volume of urine collected per the collection time in minutes (e.g., volume of urine collected in 24 hours ÷ 1440), and (3) creatinine concentration in plasma in mg/dl (P). The resulting creatinine clearance in ml/min per 1.73 m2 is derived from the formula UV/P.
Due to tubular secretion of creatinine, this formula tends to overestimate GFR by approximately 10%. In cases of advanced renal failure, where tubular secretion of creatinine is heightened, the overestimation of GFR becomes even more pronounced.
Jaffe's reaction, utilized for estimating creatinine (refer to serum creatinine), measures creatinine as well as other substances (non-creatinine chromogens) in the blood, resulting in a slightly elevated outcome. Consequently, the impact of tubular secretion of creatinine is somewhat counteracted by the minor overestimation of serum creatinine facilitated by Jaffe's reaction.
To yield values closer to the actual GFR, cimetidine, a substance that impedes secretion by renal tubules, can be administered before initiating urine collection, a method known as cimetidine-enhanced creatinine clearance.
Creatinine clearance, while widely used, possesses certain limitations for GFR estimation due to the following factors:
- A small amount of creatinine is secreted by renal tubules, a phenomenon accentuated in advanced renal failure.
- Urine collection is frequently incomplete.
- Creatinine levels are influenced by meat intake and muscle mass.
- Certain drugs, such as cimetidine, probenecid, and trimethoprim (which impede tubular secretion of creatinine), can affect creatinine levels.
Urea Clearance
Urea undergoes filtration in the glomeruli; however, approximately 40% of the filtered amount is reabsorbed by the tubules. The extent of reabsorption is contingent upon the rate of urine flow, leading to an underestimation of GFR. Urea's reliance on urine flow rate renders it less sensitive as an indicator of GFR.
When considered independently, Blood Urea Nitrogen (BUN) and serum creatinine lack sensitivity in detecting early renal impairment, as their values may register as normal. For instance, if the baseline value of serum creatinine is 0.5 mg/dl, a 50% reduction in kidney function would elevate it to 1.0 mg/dl. Therefore, clearance tests prove more beneficial in early-stage cases. In situations where biochemical tests yield normal results but renal function impairment is suspected, a creatinine clearance test becomes imperative. Conversely, if biochemical tests reveal abnormalities, clearance tests may be omitted.
What is the Difference Between GFR and eGFR?
GFR (Glomerular Filtration Rate) and eGFR (estimated Glomerular Filtration Rate) are both measures used to assess kidney function, but they have some differences. GFR is a direct measure of kidney function, while eGFR is an estimated value calculated using formulas based on serum creatinine and other factors. eGFR is more commonly used in clinical practice due to its convenience, but it's important to note that direct measurement of GFR is considered more accurate when feasible.
| Aspect | GFR (Glomerular Filtration Rate) | eGFR (estimated Glomerular Filtration Rate) |
|---|---|---|
| Defination | GFR is a measure of the volume of fluid that is filtered by the glomeruli per unit of time. It is considered the gold standard for assessing kidney function. | eGFR is an estimated value of the GFR, often calculated using mathematical formulas that take into account serum creatinine levels, age, gender, and sometimes race. |
| Measurement | GFR is usually measured directly through a clearance test, where a substance (such as inulin or creatinine) is introduced into the body, and its rate of clearance in the urine is measured. | eGFR is calculated using formulas based on serum creatinine levels, age, gender, and other factors. Commonly used formulas include the Modification of Diet in Renal Disease (MDRD) equation and the Chronic Kidney Disease Epidemiology Collaboration (CKD-EPI) equation. |
| Accuracy | Direct measurement of GFR is considered more accurate, but it may not be practical for routine clinical use. | eGFR is an estimation and may not be as accurate as direct measurement. However, it is widely used in clinical practice due to its convenience and cost-effectiveness. |
| Clinical Use | GFR is used to assess overall kidney function and is a crucial parameter in diagnosing and monitoring kidney diseases. | eGFR is a commonly used clinical parameter for assessing kidney function, especially in routine blood tests. It is often reported alongside serum creatinine levels. |
- Pathology
- Clinical Pathology
- Pathology Notes
- Notes
- Article
- How to
- Laboratory
- Laboratory Technique
- Laboratory Test Procedure
- Renal Function Test
- Creatinine Clearance Test
- Insulin Clearance Test
- Clearance of Radiolabeled Agents
- Cystatin C Clearance Test
- Urea Clearance
- Chemical Pathology
- Diseases and Disorders
Renal Biopsy: Indications, Contraindications, Complications and Procedure
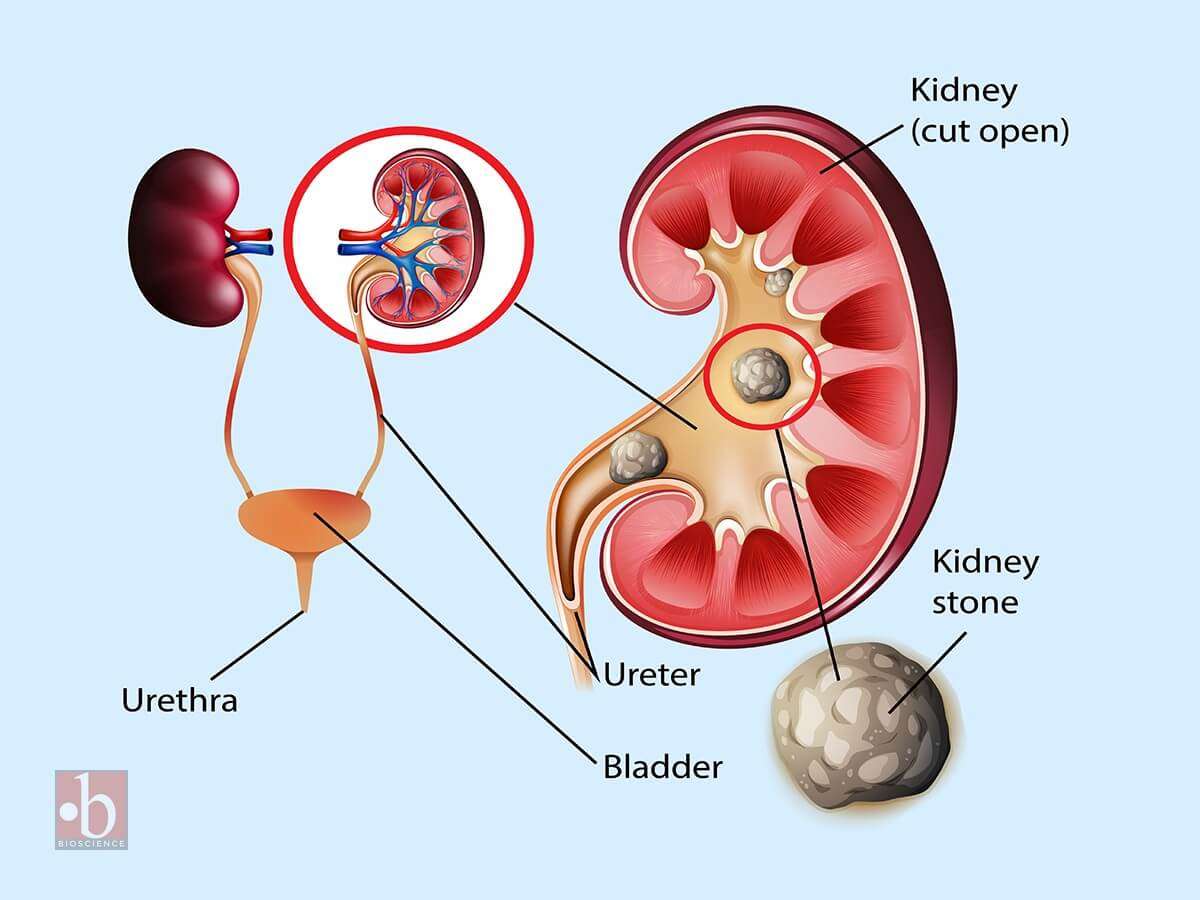
Renal biopsy (kidney biopsy) involves the extraction of a small kidney tissue sample for microscopic examination, with the first instance of percutaneous renal biopsy credited to Alwall in 1944.
For renal conditions, the utility of renal biopsy lies in:
- Establishing a precise diagnosis
- Assessing the severity and activity of the disease
- Evaluating prognosis by gauging the extent of scarring
- Planning treatment strategies and monitoring therapeutic responses
It is important to note that renal biopsy, while providing valuable diagnostic insights, carries inherent risks of procedure-related morbidity and, in rare instances, mortality. Therefore, a comprehensive assessment of the procedure's risks and the benefits derived from histologic examination should precede each renal biopsy.
Indications for Renal Biopsy
- Adults presenting with nephrotic syndrome (most prevalent indication)
- Children with nephrotic syndrome unresponsive to corticosteroid treatment.
- Acute nephritic syndrome requiring differential diagnosis
- Instances of unexplained renal insufficiency with kidney dimensions appearing nearly normal on ultrasonography
- Asymptomatic hematuria cases where other diagnostic tests fail to pinpoint the bleeding source
- Individuals with isolated non-nephrotic range proteinuria (1-3 gm/24 hours) accompanied by renal impairment
- Renal grafts displaying impaired function
- Kidney involvement in systemic diseases such as systemic lupus erythematosus or amyloidosis
Contraindications
- Uncontrolled severe hypertension
- Tendency toward hemorrhagic diathesis
- Presence of a solitary kidney
- Renal neoplasm cases (to prevent potential spread of malignant cells along the needle track)
- Presence of large and multiple renal cysts
- Kidneys displaying a small, shrunken morphology
- Active urinary tract infection, such as pyelonephritis
- Urinary tract obstruction
Complications
- Hemorrhage: Given the highly vascular nature of the renal cortex, a significant risk is the occurrence of bleeding, manifesting as hematuria or the formation of perinephric hematoma. Severe bleeding may occasionally require blood transfusion and, in rare cases, necessitate kidney removal.
- Arteriovenous fistula formation
- Infection
- Unintentional biopsy of another organ or perforation of a viscus (such as the liver, spleen, pancreas, adrenals, intestine, or gallbladder)
- Mortality (rare).
How is a Kidney Biopsy Done?
Kidney Biopsy Procedure
- Obtaining the patient's informed consent is a prerequisite.
- An ultrasound or CT scan is conducted to meticulously document the location and size of the kidneys.
- Blood pressure should be maintained below 160/90 mm Hg. Essential hematological parameters, including bleeding time, platelet count, prothrombin time, and activated partial thromboplastin time, should register within normal ranges. Blood samples are drawn for blood grouping and cross-matching, anticipating the potential need for blood transfusion.
- Prior to the procedure, the patient is appropriately sedated.
- The patient assumes a prone position, and the kidney is identified with ultrasound guidance.
- The skin over the selected site undergoes thorough disinfection, and a local anesthetic is administered.
- A small incision is made with a scalpel to accommodate the biopsy needle. Localization of the kidney is performed using a fine-bore 21 G lumbar puncture needle, with a local anesthetic infiltrated down to the renal capsule.
- Under ultrasound guidance, a tru-cut biopsy needle or spring-loaded biopsy gun is inserted and advanced to the lower pole. Typically, the biopsy is obtained from the lateral border of the lower pole. The patient is instructed to hold their breath in full inspiration during the biopsy. Once the biopsy is secured, and the needle is removed, normal breathing resumes.
- The biopsy specimen is placed in a saline drop and examined under a dissecting microscope to ensure adequacy.
- The patient is repositioned into the supine position, with continuous monitoring of vital signs and observation of urine appearance at regular intervals. Typically, patients are kept in the hospital for a 24-hour period.
The kidney biopsy process is segmented into three components for subsequent analysis: light microscopy, immunofluorescence, and electron microscopy. For light microscopy, renal biopsy specimens are routinely fixed in neutral buffered formaldehyde. Staining includes:
- Hematoxylin and eosin (for an overall assessment of kidney architecture and cellularity)
- Periodic acid-Schiff: To accentuate the basement membrane and connective tissue matrix.
- Congo red: Utilized for amyloid identification.
For electron microscopy, tissue fixation is achieved with glutaraldehyde. In immunohistochemistry, the presence of tissue deposits of IgG, IgA, IgM, C3, fibrin, and κ and λ light chains can be identified using specific antibodies. Many kidney diseases exhibit immune-complex mediation.
- Pathology
- Clinical Pathology
- Histopathology
- Biopsy
- Renal Biopsy
- Diseases and Disorders
- Laboratory
- Laboratory Technique
- Laboratory Test Procedure
- Renal Biopsy Indications
- Renal Biopsy Contraindications
- Renal Biopsy Complications
- Renal Biopsy Procedure
- Risks in Renal Biopsy Procedure
- Pathology Notes
- How to
- Article
- Notes
- Renal Function Test
Role of Laboratory Tests in Diabetes Mellitus

Diabetes mellitus (DM) is a metabolic group of disorders marked by persistent hyperglycemia, a consequence of insulin deficiency and/or diminished insulin effectiveness. This condition induces disruptions in carbohydrate, protein, and fat metabolism, arising from the failure of insulin action on target cells.
Distinctive features of DM encompass:
- Fasting hyperglycemia
- Presence of glycosuria
- Manifestation of symptoms linked to pronounced hyperglycemia, including polyuria, polydipsia, weight loss, weakness, polyphagia, and blurred vision
- Long-term complications, such as atherosclerosis leading to ischemic heart disease, cerebrovascular disease, and peripheral vascular disease, and microangiopathy, which can result in nephropathy with a risk of renal failure; retinopathy with potential vision loss; and peripheral neuropathy with a risk of foot ulcers, amputations, or Charcot joints
- Acute metabolic complications, including hyperosmolar hyperglycemic state and diabetic ketoacidosis
- Susceptibility to infections, particularly affecting the skin, respiratory tract, and urinary tract.
In DM, applications of laboratory tests are as follows:
- Diagnosis of DM
- Screening of DM
- Assessment of glycemic control
- Assessment of associated long-term risks
- Management of acute metabolic complications.
Laboratory Tests for Diagnosis of Diabetes Mellitus
The diagnosis of diabetes mellitus (DM) relies exclusively on the demonstration of elevated blood glucose levels, indicating hyperglycemia. The current diagnostic criteria, as outlined by the American Diabetes Association in 2004, include the following parameters:
- Presence of typical symptoms of DM such as polyuria, polydipsia, and weight loss, coupled with a random plasma glucose level of ≥ 200 mg/dl (≥ 11.1 mmol/L).
- Fasting plasma glucose level ≥ 126 mg/dl (≥ 7.0 mmol/L).
- A 2-hour post glucose load (75 g) value during an oral glucose tolerance test ≥ 200 mg/dl (≥ 11.1 mmol/L).
In the event that any of the above three criteria is met, confirmation through repeat testing on a subsequent day becomes imperative for establishing the diagnosis of DM. However, it's noteworthy that confirmation by repeat testing is waived if the patient presents with either (a) hyperglycemia and ketoacidosis, or (b) hyperosmolar hyperglycemia.
The laboratory tests employed for the diagnosis of DM encompass the estimation of blood glucose levels and the oral glucose tolerance test.
Estimation of Blood Glucose
Assessing carbohydrate metabolism in individuals with diabetes mellitus (DM) can be efficiently accomplished through a straightforward examination of blood glucose levels (refer to Figure 1). Given the body's rapid metabolism of glucose, the measurement of blood glucose serves as a reliable indicator, providing valuable insights into the present status of carbohydrate metabolism.
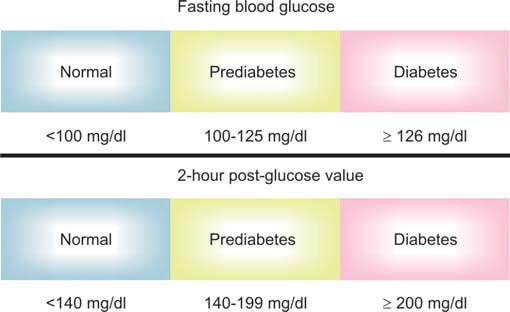
The estimation of glucose concentration can be conducted in various blood specimens, including whole blood (capillary or venous blood), plasma, or serum. It's important to note that the concentration of blood glucose varies depending on the nature of the blood specimen. Specifically, plasma glucose tends to be approximately 15% higher than whole blood glucose, with this discrepancy influenced by the individual's hematocrit levels. During the fasting state, both capillary and venous blood exhibit similar glucose levels. However, in the postprandial or post-glucose load phase, capillary blood values surpass venous blood levels by 20-70 mg/dl. This disparity arises because venous blood is returning after delivering blood to the body's tissues.
When whole blood is allowed to remain at room temperature after collection, glycolysis ensues, leading to a gradual reduction in glucose levels at a rate of approximately 7 mg/dl per hour. The glycolytic process is further heightened in the presence of bacterial contamination or leucocytosis. To mitigate this, the addition of sodium fluoride (2.5 mg/ml of blood) proves effective in maintaining a stable glucose level by inhibiting glycolysis. Sodium fluoride is commonly employed in conjunction with anticoagulants such as potassium oxalate or EDTA.
The incorporation of sodium fluoride becomes unnecessary if plasma is promptly separated from whole blood within 1 hour of the blood collection process. This practice ensures the preservation of glucose levels without the need for additional interventions.
Plasma is the preferred medium for estimating glucose levels, as whole blood glucose can be influenced by the concentration of proteins, particularly hemoglobin.
Various methods exist for assessing blood glucose:
- Chemical methods:
- Orthotoluidine method
- Blood glucose reduction methods using neocuproine, ferricyanide, or copper.
While chemical methods are less specific, they offer a cost-effective alternative to enzymatic methods.
- Enzymatic methods: These methods are specific to glucose.
- Glucose oxidase-peroxidase
- Hexokinase
- Glucose dehydrogenase
Enzymatic methods have superseded chemical methods in contemporary glucose estimation.
Terminology for blood glucose specimens: Different terms are employed based on the time of collection for blood glucose specimens.
- Fasting blood glucose: A sample for blood glucose is drawn after an overnight fast (no caloric intake for at least 8 hours).
- Post-meal or postprandial blood glucose: A blood sample for glucose estimation is collected 2 hours after the subject has consumed a regular meal.
- Random blood glucose: A blood sample is collected at any time of the day, without consideration of the time since the last food intake.
Oral Glucose Tolerance Test (OGTT)
Glucose tolerance pertains to the body's capacity to metabolize glucose. In the context of Diabetes Mellitus (DM), this capability becomes compromised or entirely lost, with glucose intolerance emerging as the foundational pathophysiological anomaly in DM. The Oral Glucose Tolerance Test (OGTT) serves as a provocative examination to evaluate an individual's response to a glucose challenge (refer to Figure 2).
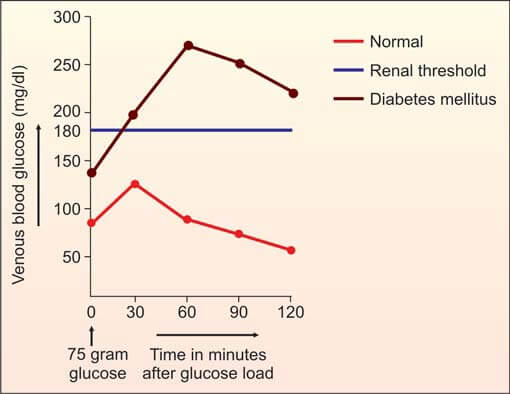
The American Diabetes Association discourages the routine use of OGTT for diagnosing type 1 or type 2 diabetes mellitus. This stance stems from the fact that a fasting plasma glucose cutoff value of 126 mg/dl reveals a comparable prevalence of abnormal glucose metabolism in the population as OGTT. Conversely, the World Health Organization (WHO) advocates for OGTT when fasting plasma glucose falls within the impaired fasting glucose range (i.e., 100-125 mg/dl). Both ADA and WHO endorse OGTT as the preferred diagnostic method for gestational diabetes mellitus.
Preparation of the Patient
- The individual should adhere to a carbohydrate-rich, unrestricted diet for a duration of 3 days. This dietary approach is recommended due to the observed reduction in glucose tolerance associated with a carbohydrate-restricted regimen.
- The patient should maintain an ambulatory lifestyle with normal physical activity. Prolonged bed rest, even for a few days, has been shown to impair glucose tolerance.
- All medications should be discontinued on the day of testing to ensure accurate assessment.
- During the test period, the individual should abstain from exercise, smoking, and the consumption of tea or coffee. It is essential for the patient to remain in a seated position throughout the testing period.
- The Oral Glucose Tolerance Test (OGTT) should be conducted in the morning, following an overnight fast of 8-14 hours.
Test
- In the morning, a fasting venous blood sample is obtained.
- The patient is administered 75 g of anhydrous glucose dissolved in 250-300 ml of water over a span of 5 minutes. For pediatric patients, the dose is calculated as 1.75 g of glucose per kg of body weight, up to a maximum of 75 g of glucose. The initiation of the glucose drink marks the 0-hour time point.
- A singular venous blood sample is drawn 2 hours after the glucose load. It is noteworthy that the previous practice of collecting blood samples at ½, 1, 1½, and 2 hours is now deemed outdated and not recommended.
- Fasting and 2-hour venous blood samples are used to estimate plasma glucose levels.
The interpretation of blood glucose levels can be found in Table 1.
| Parameter | Normal | Impaired fasting glucose | Impaired glucose tolerance | Diabetes mellitus |
|---|---|---|---|---|
| Fasting (8 hr) | < 100 | 100-125 | — | ≥ 126 |
| 2 hr OGTT | < 140 | < 140 | 140-199 | ≥ 200 |
Oral Glucose Tolerance Test (OGTT) in Gestational Diabetes Mellitus: The impairment of glucose tolerance is a common occurrence during pregnancy, especially in the second and third trimesters. The American Diabetes Association (ADA) provides the following recent guidelines for the laboratory diagnosis of Gestational Diabetes Mellitus (GDM):
- Low-risk pregnant women may forego testing if they meet all the following criteria: age below 25 years, normal pre-pregnancy body weight, absence of diabetes in first-degree relatives, belonging to an ethnic group with a low prevalence of diabetes, no history of poor obstetric outcomes, and no prior instances of abnormal glucose tolerance.
- For average-risk pregnant women, falling between low and high risk, testing is recommended at 24-28 weeks of gestation.
- High-risk pregnant women—those meeting any one of the following criteria—should undergo immediate testing: marked obesity, a strong family history of diabetes, presence of glycosuria, or a personal history of Gestational Diabetes Mellitus (GDM).
Initially, it is recommended to obtain either fasting plasma glucose or random plasma glucose. If the fasting plasma glucose measures ≥ 126 mg/dl or the random plasma glucose is ≥ 200 mg/dl, a follow-up test should be conducted on a subsequent day to confirm the diagnosis of Diabetes Mellitus (DM). In cases where both initial tests yield normal results, the Oral Glucose Tolerance Test (OGTT) is indicated for both average-risk and high-risk pregnant women.
Two distinct approaches exist for the laboratory diagnosis of Gestational Diabetes Mellitus (GDM):
- One-Step Approach
- Two-Step Approach
Within the one-step approach, the patient is administered 100 grams of glucose, and a subsequent 3-hour Oral Glucose Tolerance Test (OGTT) is conducted. This particular testing protocol may prove to be a cost-effective strategy, especially for high-risk pregnant women.
Alternatively, in the two-step approach, an initial screening test is initiated wherein the patient consumes a 50-gram glucose drink, irrespective of the time elapsed since their last meal. A venous blood sample is then collected 1 hour post-ingestion (commonly known as O'Sullivan's test). Gestational Diabetes Mellitus (GDM) is ruled out if the glucose level in the venous plasma sample falls below 140 mg/dl. Conversely, if the glucose level exceeds 140 mg/dl, a comprehensive 100-gram, 3-hour OGTT is subsequently conducted for further evaluation.
During the 3-hour Oral Glucose Tolerance Test (OGTT), blood samples are systematically collected in the morning following an overnight fast lasting 8-10 hours. Subsequent samples are obtained at 1, 2, and 3 hours post-ingestion of 100 grams of glucose. To establish a diagnosis of Gestational Diabetes Mellitus (GDM), glucose concentrations should surpass the designated cut-off values in two or more of the venous plasma samples:
- Fasting: 95 mg/dl
- 1 hour: 180 mg/dl
- 2 hours: 155 mg/dl
- 3 hours: 140 mg/dl
Laboratory Tests for Screening of Diabetes Mellitus
The primary objective of screening is the identification of asymptomatic individuals with a likelihood of having Diabetes Mellitus (DM). Given that early detection and the prompt initiation of treatment can mitigate subsequent complications associated with DM, screening becomes a judicious course of action in certain scenarios.
Screening for Type 2 DM: Type 2 DM stands as the most prevalent form of DM, typically manifesting as asymptomatic in its initial phases. Its onset transpires approximately 5-7 years prior to clinical diagnosis, with evidence suggesting that complications of Type 2 DM commence many years before the manifestation of clinical symptoms. The American Diabetes Association advocates for the screening of Type 2 DM in all asymptomatic individuals aged ≥ 45 years, utilizing fasting plasma glucose as the diagnostic criterion. In instances where fasting plasma glucose registers as normal (i.e., < 100 mg/dl), the screening test should be repeated at three-year intervals.
An alternative strategy involves selective screening, wherein individuals at a heightened risk of developing Type 2 Diabetes Mellitus (DM) are targeted. This includes those with one or more of the following risk factors: obesity (body mass index ≥ 25.0 kg/m2), a family history of DM (first-degree relative with DM), belonging to a high-risk ethnic group, hypertension, dyslipidemia, impaired fasting glucose, impaired glucose tolerance, or a history of Gestational Diabetes Mellitus (GDM). In such instances, screening is initiated at an earlier age, typically 30 years, and is conducted more frequently.
The recommended screening test for Type 2 DM is fasting plasma glucose. If the result is ≥126 mg/dl, it is advised to repeat the test on a subsequent day for confirmation of the diagnosis. In cases where the result is <126 mg/dl, an Oral Glucose Tolerance Test (OGTT) is recommended if there is a strong clinical suspicion. A 2-hour post-glucose load value in the OGTT that registers ≥200 mg/dl is indicative of DM and warrants confirmation through repetition on a different day.
Screening for Type 1 Diabetes Mellitus (DM): Type 1 DM is typically identified soon after its onset due to its acute presentation and distinctive clinical features. As a result, there is no imperative need to conduct routine blood glucose screening for Type 1 DM. The detection of immunologic markers, as mentioned earlier, is not currently recommended as a method to identify individuals at risk for Type 1 DM.
Screening for Gestational Diabetes Mellitus (GDM): Detailed information is provided earlier under the section on Oral Glucose Tolerance Test (OGTT) in gestational diabetes mellitus.
Laboratory Tests to Assess Glycemic Control
There exists a clear correlation between the extent of blood glucose control in both Type 1 and Type 2 Diabetes Mellitus (DM) and the emergence of microangiopathic complications, specifically nephropathy, retinopathy, and neuropathy. Sustaining blood glucose levels as close to normal as feasible, commonly denoted as tight glycemic control, serves to diminish the risk of microvascular complications. Additionally, persistent elevation of blood glucose values in DM is linked to heightened cardiovascular mortality.
The following methods are employed to monitor the degree of glycemic control:
- Regular assessment of glycated hemoglobin through periodic measurements to evaluate long-term control.
- Daily self-monitoring of blood glucose for the evaluation of day-to-day or immediate control.
Glycated Hemoglobin (Glycosylated Hemoglobin, HbA1C)
Glycated hemoglobin refers to hemoglobin to which glucose is nonenzymatically and irreversibly attached. Its quantity is contingent upon both blood glucose levels and the lifespan of red blood cells.
The interaction follows the equation: Hemoglobin + Glucose ↔ Aldimine → Glycated hemoglobin
Plasma glucose readily traverses the membranes of red blood cells, continuously binding with hemoglobin throughout the lifespan of these cells, which is approximately 120 days. Consequently, a portion of hemoglobin within red blood cells normally exists in a glycated form. The concentration of glycated hemoglobin in the bloodstream is influenced by both blood glucose levels and the lifespan of red blood cells. Higher blood glucose concentrations result in increased glycation of hemoglobin. Once glycated, hemoglobin undergoes an irreversible transformation. The level of glycated hemoglobin reflects the average glucose level over the preceding 6-8 weeks, approximately 2 months. This measurement is expressed as a percentage of total hemoglobin, with normal values typically below 5%.
Several prospective studies have consistently shown that maintaining optimal blood glucose control significantly diminishes the incidence and advancement of microvascular complications—namely, retinopathy, nephropathy, and peripheral neuropathy—in individuals with diabetes mellitus. The average level of glycated hemoglobin is closely associated with the risk of developing these complications.
The terms glycated hemoglobin, glycosylated hemoglobin, glycohemoglobin, HbA1, and HbA1c are commonly used interchangeably in clinical practice, denoting hemoglobins with nonenzymatically added glucose residues, albeit with variations in the modifications. Predominantly, studies have focused on HbA1c.
Routinely measuring glycated hemoglobin is essential for both type 1 and type 2 diabetic patients at regular intervals to evaluate the extent of long-term glycemic control. Beyond reflecting mean glycemia over the preceding 120 days, glycated hemoglobin levels also align with the risk of developing chronic complications associated with Diabetes Mellitus (DM). In the context of DM, it is advisable to maintain glycated hemoglobin levels below 7%.
Box 1: Glycated hemoglobin
- Hemoglobin A1C of 6% corresponds to mean serum glucose level of 135 mg/dl. With every rise of 1%, serum glucose increases by 35 mg/dl. Approximations are as follows:
- Hb A1C 7%: 170 mg/dl
- Hb A1C 8%: 205 mg/dl
- Hb A1C 9%: 240 mg/dl
- Hb A1C 10%: 275 mg/dl
- Hb A1C 11%: 310 mg/dl
- Hb A1C 12%: 345 mg/dl
- Assesses long-term control of DM (thus indirectly confirming plasma glucose results or self-testing results).
- Assesses whether treatment plan is working
- Measurement of glycated hemoglobin does not replace measurement of day-to-day control by glucometer devices.
Artifactual outcomes in glycated hemoglobin testing may arise in conditions of diminished red cell survival (hemolysis), instances of blood loss, and certain hemoglobinopathies.
In the context of Diabetes Mellitus (DM), a glycated hemoglobin level below 7% warrants biannual measurements. Conversely, if the level exceeds 8%, more frequent assessments (every 3 months) are recommended, accompanied by potential adjustments in the treatment regimen.
Diverse methods, including chromatography, immunoassay, and agar gel electrophoresis, are employed for the measurement of glycated hemoglobin.
The pivotal role of glycated hemoglobin in the management of DM is underscored in Box 1.
Self-Monitoring of Blood Glucose (SMBG)
Individuals with diabetes receive instruction on the regular self-monitoring of their blood glucose levels. The widespread utilization of Self-Monitoring of Blood Glucose (SMBG) devices, such as portable glucose meters, has significantly enhanced the management of Diabetes Mellitus (DM). These devices empower diabetic individuals to monitor their blood glucose levels on a daily basis, facilitating adjustments to insulin dosage to maintain levels as close to normal as possible. SMBG devices measure capillary whole blood glucose extracted through a fingerprick, utilizing test strips that incorporate glucose oxidase or hexokinase. Some strips integrate a layer to exclude blood cells, allowing the measurement of glucose in plasma. However, it's essential to recognize that the pursuit of tight glycemic control introduces the risk of severe hypoglycemia, a risk mitigated by the daily use of SMBG devices.
SMBG devices may produce unreliable results at extremely high and low glucose levels. To ensure accuracy, it is imperative to periodically assess the glucometer's performance by comparing results with parallel venous plasma glucose measurements in the laboratory.
While portable glucose meters serve as invaluable tools for day-to-day self-monitoring by patients, in outpatient clinic settings by physicians, and for bedside monitoring of admitted patients by healthcare workers, their application for the diagnosis and population screening of DM is cautioned against. The lack of precision and variability in results among different meters impede their suitability for such purposes.
The objective of achieving meticulous glycemic control in individuals with Type 1 Diabetes Mellitus (DM) using insulin can be realized through the self-monitoring of blood glucose levels using portable blood glucose meters.
Glycosuria
Semiquantitative urine glucose testing for diabetes mellitus monitoring in a home setting is not advisable. This is primarily due to:
- Absence of Information on Blood Glucose Concentration Below Renal Threshold: Even if urine glucose is undetectable, it provides no insights into blood glucose concentrations below the variable renal threshold (typically around 180 mg/dl; lower in pregnancy at 140 mg/dl, higher in the elderly and long-standing diabetics, and variable in some normal individuals with a low threshold).
- Inability to Detect Hypoglycemia: Urinary glucose testing lacks the capacity to identify hypoglycemic episodes.
- Impact of Urinary Concentration: The concentration of glucose in urine is influenced by urinary concentration, rendering semiquantitative urine glucose testing less reliable.
Semiquantitative urine glucose testing for monitoring has now been supplanted by the more accurate self-testing facilitated by portable glucose meters.
Laboratory Tests to Assess Long-term Risks
Urinary Albumin Excretion
Diabetes mellitus stands as a primary contributor to renal failure, with diabetic nephropathy manifesting in approximately 20-30% of individuals diagnosed with either type 1 or type 2 DM. The progression of diabetic nephropathy unfolds through distinct stages, as illustrated in Figure 3. Concurrently, hypertension ensues along the nephropathic course, correlating with escalating albumin excretion. Research affirms that early detection of diabetic nephropathy, coupled with targeted interventions, significantly mitigates the progression of renal impairment. The foundational strategy for early diabetic nephropathy identification involves assessing urinary albumin excretion.
For all adult patients with DM, routine reagent strip tests for proteinuria should be periodically conducted. A positive result indicates the presence of overt proteinuria or clinical proteinuria, potentially signaling overt nephropathy. In such cases, quantifying albuminuria is imperative to tailor appropriate therapeutic strategies. In instances where the routine dipstick test for proteinuria yields a negative result, screening for microalbuminuria is recommended.
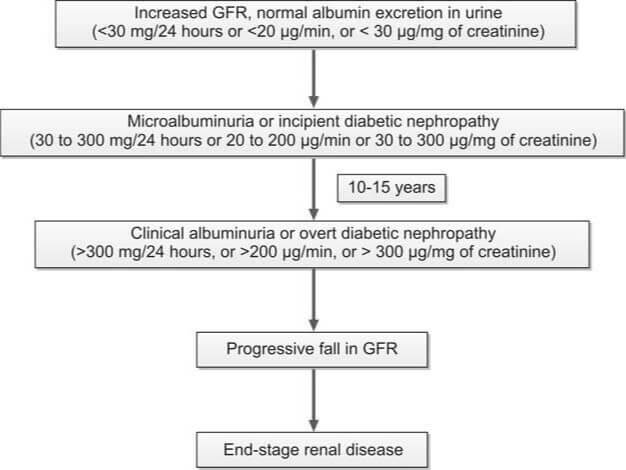
The term 'microalbuminuria' denotes the urinary excretion of albumin falling below the detection threshold of routine dipstick testing but surpassing normal levels (30-300 mg/24 hrs, 20-200 μg/min, or 30-300 μg/mg of creatinine). The albumin excretion rate in this range lies between the parameters of normal (urinary albumin excretion < 30 mg/24 hours) and overt albuminuria (> 300 mg/24 hours). The significance of microalbuminuria in Diabetes Mellitus (DM) encompasses the following aspects:
- Earliest Marker of Diabetic Nephropathy: Microalbuminuria serves as the earliest discernible marker of diabetic nephropathy, with the potential for reversibility during the early stages of the condition.
- Risk Factor for Cardiovascular Disease: It represents a risk factor for cardiovascular disease in both type 1 and type 2 diabetic patients.
- Association with Blood Pressure and Glycemic Control: Microalbuminuria is linked to elevated blood pressure levels and suboptimal glycemic control.
Targeted therapeutic interventions, such as meticulous glycemic control, the administration of ACE (angiotensin-converting enzyme) inhibitors, and assertive management of hypertension, play a pivotal role in significantly decelerating the progression of diabetic nephropathy.
In the case of type 2 Diabetes Mellitus (DM), the initiation of microalbuminuria screening is recommended at the time of diagnosis. Conversely, for type 1 DM, this screening should commence 5 years after the initial diagnosis. During this assessment, a routine reagent strip test for proteinuria is conducted; if the result is negative, subsequent testing for microalbuminuria is performed. Subsequently, for patients with negative findings, periodic screening for microalbuminuria is advised on an annual basis.
Screening tests for microalbuminuria encompass:
- Albumin-to-creatinine ratio in a random urine sample.
- Measurement of urinary albumin excretion in a 24-hour urine sample.
There are reagent strip tests designed for the identification of microalbuminuria. Affirmative outcomes from these tests necessitate validation through more precise quantitative methods, such as radioimmunoassay and enzyme immunoassay. To establish the diagnosis of microalbuminuria, positive test results should be consistent across at least two out of three distinct samples obtained over a 3 to 6 month duration.
Lipid Profile
Disruptions in lipid profiles are linked to an elevated risk of coronary artery disease (CAD) in individuals with Diabetes Mellitus (DM). The mitigation of this risk can be achieved through the intensive treatment of lipid irregularities. Essential lipid parameters that merit measurement encompass:
- Total cholesterol
- Triglycerides
- Low-density lipoprotein (LDL) cholesterol
- High-density lipoprotein (HDL) cholesterol
The prevailing lipid aberrations in type 2 DM typically manifest as heightened triglyceride levels, diminished HDL cholesterol, and an increased proportion of small, dense LDL particles. Individuals with DM are stratified into high, intermediate, and low-risk categories based on their blood lipid levels (refer to Table 2).
| Category | Low density lipoproteins | High density lipoproteins | Triglycerides |
|---|---|---|---|
| High-risk | ≥130 |
|
≥ 400 |
| Intermediate risk | 100-129 | 35-45 | 200-399 |
| Low-risk | < 100 |
|
< 200 |
An annual assessment of the lipid profile is recommended for all adult patients diagnosed with Diabetes Mellitus.
Laboratory Tests in the Management of Acute Metabolic Complications of Diabetes Mellitus
The three most critical acute metabolic complications associated with Diabetes Mellitus (DM) are:
- Diabetic ketoacidosis (DKA)
- Hyperosmolar hyperglycemic state (HHS)
- Hypoglycemia
DKA is characterized by hyperglycemia, ketosis, and acidosis. Common triggers for DKA include infection, noncompliance with insulin therapy, alcohol abuse, and myocardial infarction. Patients experiencing DKA typically present with rapid-onset polyuria, polydipsia, polyphagia, weakness, vomiting, and sometimes abdominal pain. Clinical signs encompass Kussmaul’s respiration, a fruity odor of acetone on breath, mental clouding, and dehydration. While DKA is classically associated with type 1 DM, HHS is more typical of type 2 DM. However, it's important to note that both complications can occur in either type. If left untreated, both DKA and HHS can progress to coma and result in fatality.
Hyperosmolar hyperglycemic state is distinguished by markedly elevated blood glucose levels (> 600 mg/dl), hyperosmolality (>320 mOsmol/kg of water), dehydration, absence of ketoacidosis, and altered mental status. This condition predominantly affects elderly individuals with type 2 diabetes. In HHS, insulin secretion is sufficient to prevent ketosis but not hyperglycemia. Causative factors for HHS include illness, dehydration, surgery, and glucocorticoid therapy.
The distinctions between DKA and HHS are summarized in Table 3.
| Parameter | Diabetic ketoacidosis | Hyperosmolar hyperglycemic state |
|---|---|---|
| Type of DM in which more common | Type 1 | Type 2 |
| Age | Younger age | Older age |
| Prodromal clinical features | < 24 hrs | Several days |
| Abdominal pain, Kussmaul’s respiration | Yes | No |
| Acidosis | Moderate/Severe | Absent |
| Plasma glucose | > 250 mg/dl | Very high (>600 mg/dl) |
| Serum bicarbonate | <15 mEq/L | >15 mEq/L |
| Blood/urine ketones | ++++ | ± |
| β-hydroxybutyrate | High | Normal or raised |
| Arterial blood pH | Low (<7.30) | Normal (>7.30) |
| Effective serum osmolality* | Variable | Increased (>320) |
| Anion gap** | >12 | Variable |
|
||
Laboratory assessment encompasses the following investigations:
- Blood and urine glucose
- Blood and urine ketones
- Arterial pH, Blood gases
- Serum electrolytes (sodium, potassium, chloride, bicarbonate)
- Blood osmolality
- Serum creatinine and blood urea
Testing for ketone bodies: Ketone bodies, including acetoacetic acid, acetone, and β-hydroxybutyric acid, result from the metabolism of free fatty acids.
Indications for ketone body testing in Diabetes Mellitus include:
- At the time of diabetes mellitus diagnosis
- At regular intervals for all known diabetes cases, during pregnancy with pre-existing diabetes, and in gestational diabetes
- In known diabetic patients: during acute illness, persistent hyperglycemia (> 300 mg/dl), pregnancy, and clinical evidence of diabetic acidosis (nausea, vomiting, abdominal pain)
An elevated concentration of ketone bodies in DM patients signals impending or established diabetic ketoacidosis, constituting a medical emergency. A colorimetric reaction between ketone bodies and nitroprusside (via dipstick or tablet) is the method used for detecting both blood and urine ketones.
However, the test for urine ketones alone is not recommended for diagnosing and monitoring diabetic ketoacidosis. The measurement of β-hydroxybutyric acid, representing 75% of all ketones in ketoacidosis, is advised for diagnosis and monitoring of DKA.
Reference Ranges
- Venous plasma glucose:
- Fasting: 60-100 mg/dl
- At 2 hours in OGTT (75 gm glucose): <140 mg/dl
- Glycated hemoglobin: 4-6% of total hemoglobin
- Lipid profile:
- Serum cholesterol: Desirable level: <200 mg/dl
- Serum triglycerides: Desirable level: <150 mg/dl
- HDL cholesterol: ≥60 mg/dl
- LDL cholesterol: <130 mg/dl
- LDL/HDL ratio: 0.5-3.0
- C-peptide: 0.78-1.89 ng/ml
- Arterial pH: 7.35-7.45
- Serum or plasma osmolality: 275-295 mOsm/kg of water.
- Serum osmolality can be computed using the formula endorsed by the American Diabetes Association: Effective serum osmolality (mOsm/kg) = (2 × sodium mEq/L) + Plasma glucose (mg/dl) / 18
- Anion gap:
- Na+ – (Cl– + HCO3–): 8-16 mmol/L (Average 12)
- (Na+ + K+) – (Cl– + HCO3–): 10-20 mmol/L (Average 16)
- Serum sodium: 135-145 mEq/L
- Serum potassium: 3.5-5.0 mEq/L
- Serum chloride: 100-108 mEq/L
- Serum bicarbonate: 24-30 mEq/L
Critical Values
- Venous plasma glucose: > 450 mg/dl
- Strongly positive test for glucose and ketones in urine
- Arterial pH: < 7.2 or > 7.6
- Serum sodium: < 120 mEq/L or > 160 mEq/L
- Serum potassium: < 2.8 mEq/L or > 6.2 mEq/L
- Serum bicarbonate: < 10 mEq/L or > 40 mEq/L
- Serum chloride: < 80 mEq/L or > 115 mEq/L
- Pathology
- Clinical Pathology
- Chemical Pathology
- Pathology Notes
- Notes
- Article
- How to
- Laboratory
- Laboratory Technique
- Laboratory Test Procedure
- Laboratory Tests for Diagnosis of Diabetes Mellitus
- Role of Laboratory Tests in Diabetes Mellitus
- Diabetes Mellitus Definition
- Diabetes Mellitus Type 2
- Diabetes Mellitus Type 1
- Type 2 Diabetes Causes
- Type 2 Diabetes Causes and Symptoms
- Treatment of Type 2 Diabetes
- Effects of Type 2 Diabetes
- Type 2 Diabetes Prevention
- Diabetes Prevention Tips
- Diseases and Disorders
Pregnancy Tests: Clinical Applications and Tests for hCG

Pregnancy tests are designed to identify human chorionic gonadotropin (hCG) in either serum or urine. While the primary purpose of hCG testing is pregnancy detection, there are additional indications for measuring hCG, detailed in Box 1.
Human chorionic gonadotropin, a glycoprotein hormone originating from the placenta, circulates in maternal blood and is excreted intact through the kidneys. Comprising two polypeptide subunits—α (92 amino acids) and β (145 amino acids—hCG forms a non-covalent bond between these subunits. Structurally, hCG shares close similarities with three other glycoprotein hormones: luteinizing hormone (LH), follicle-stimulating hormone (FSH), and thyroid-stimulating hormone (TSH). The α subunits of hCG, LH, FSH, and TSH exhibit similarity, while the β subunits differ, conferring specific biological and immunological properties. Immunological tests deploy antibodies targeting the β-subunit of hCG to prevent cross-reactivity with LH, FSH, and TSH.
Box 1: Indications for measurement of β human chorionic gonadotropin
The syncytiotrophoblastic cells within the conceptus, and subsequently in the placenta, play a crucial role in the synthesis of hCG, also known as human chorionic gonadotropin. This hormone serves to support the corpus luteum of the ovary during the initial stages of pregnancy. The corpus luteum, in turn, produces progesterone, which acts to inhibit ovulation and thereby sustains the ongoing pregnancy.
As gestation progresses to the 7-10 week mark, the placenta becomes proficient in generating adequate quantities of progesterone independently. At this stage, the reliance on hCG diminishes, leading to a decline in its levels.
Clinical Applications of Tests for Human Chorionic Gonadotropin
- Early Pregnancy Diagnosis: The qualitative serum hCG test yields a positive result three weeks after the last menstrual period (LMP), while the urine hCG test shows positivity at five weeks post-LMP.
- Preventing Teratogenic Effects: Prior to prescribing specific medications such as oral contraceptives, steroids, and certain antibiotics, as well as before initiating radiological studies, radiotherapy, or chemotherapy, it is crucial to exclude pregnancy. This precautionary measure aims to prevent potential teratogenic effects on the developing fetus.
- Early Detection of Ectopic Pregnancy: Utilizing trans-vaginal ultrasonography (USG) and quantitatively estimating hCG proves valuable in the early identification of ectopic pregnancies, particularly before the occurrence of rupture.
- Assessment of Threatened Abortion: Serial quantitative estimation of hCG serves as a valuable tool in monitoring the progression of threatened abortion.
- Diagnosis and Monitoring of Gestational Trophoblastic Disease (GTD): The diagnostic and follow-up aspects of gestational trophoblastic disease (GTD) are effectively addressed through appropriate hCG assessments.
- Maternal Triple Test Screen: Conducted between the 14th and 19th weeks of gestation, the maternal triple test screen involves measuring hCG, α-fetoprotein, and unconjugated estriol in maternal serum. This screening method aids in identifying pregnant women at an elevated risk of Down syndrome and major congenital anomalies, including neural tube defects.
- Follow-Up of Germ Cell Tumors: The monitoring of ovarian or testicular germ cell tumors, known for hCG production, is facilitated through appropriate follow-up measures.
Normal Pregnancy
Box 2: Diagnosis of early pregnancy
- Positive serum hCG test: 8 days after conception or 3 weeks after last menstrual period (LMP)
- Positive urine hCG test: 21 days after conception or 5 weeks after LMP
- Ultrasonography for visualization of gestational sac:
- Transvaginal: 21 days after conception or 5 weeks after LMP
- Transabdominal: 28 days after conception or 6 weeks after LMP
In women with a regular menstrual cycle, the process of conception, marked by the fertilization of the ovum to form a zygote, typically takes place on day 14 within the fallopian tube. The resulting zygote then traverses the fallopian tube before reaching the uterus. Subsequent divisions of the zygote lead to the formation of a morula. At the 50-60-cell stage, this morula undergoes further development, giving rise to a blastocyst. Approximately 5 days post-fertilization, the blastocyst implants into the uterine wall. Trophoblastic cells, situated on the outer surface of the blastocyst, penetrate the endometrium and evolve into chorionic villi. Two primary types of trophoblasts emerge—the syncytiotrophoblast and cytotrophoblast. The development of the placenta originates from these chorionic villi. Once the placenta is formed, the term ‘embryo’ is applied to the conceptus. Subsequently, when the embryo progresses to the stage of developing most major organs, it is termed a ‘fetus’, a designation established after 10 weeks of gestation.
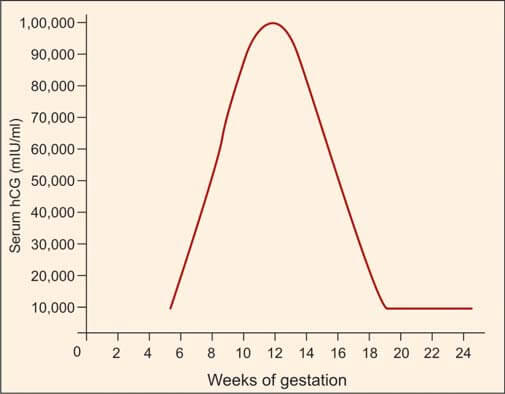
Human chorionic gonadotropin (hCG) is synthesized by syncytiotrophoblasts, primarily located in the placenta. Detectable amounts of hCG, approximately 5 mIU/ml, emerge in maternal serum around 8 days after conception, corresponding to 3 weeks after the last menstrual period (LMP). During the initial trimester, spanning the first 12 weeks from the onset of LMP, hCG levels undergo a rapid ascent, with a doubling time of roughly 2 days. The pinnacle, or peak level, is achieved between 8 and 10 weeks, reaching approximately 100,000 mIU/ml. Subsequently, a gradual decline ensues, stabilizing at 10,000-20,000 mIU/ml from 15-16 weeks onward, maintaining this level throughout the remainder of the pregnancy (refer to Figure 1). Post-delivery, hCG becomes non-detectable within about 2 weeks.
Referencing Box 2, the minimum time required for the earliest diagnosis of pregnancy is outlined, utilizing hCG tests and ultrasonography (USG).
There are two primary categories of pregnancy tests:
- Qualitative tests: These yield positive/negative results and are conducted on a urine sample.
- Quantitative tests: Providing numerical results, these tests are performed on either serum or urine. They find application in evaluating ectopic pregnancies, monitoring failing pregnancies, and conducting follow-up assessments for gestational trophoblastic disease.
Ectopic Pregnancy
Ectopic pregnancy denotes the implantation of a blastocyst at a site outside the uterine cavity. In over 95% of cases, this occurs in the fallopian tube. Timely identification and intervention in tubal ectopic pregnancies are imperative due to the associated risks of maternal mortality, stemming from rupture and hemorrhage, as well as the potential for future infertility. Ectopic pregnancy stands as a prominent cause of maternal death in the first trimester. Ultrasonography and the estimation of the β-subunit of human chorionic gonadotropin (hCG) are effective diagnostic tools in most cases.
The early diagnosis of an unruptured tubal pregnancy involves quantitative serum hCG estimation and ultrasonography. In a typical intrauterine pregnancy, the hCG titer doubles every 2 days until the first 40 days of gestation. An abnormally sluggish rise in hCG suggests a potentially nonviable pregnancy, encompassing ectopic or abnormal intrauterine pregnancies.
Transabdominal ultrasonography can identify the gestational sac in intrauterine pregnancies 6 weeks post-last menstrual period (LMP), concomitant with a serum hCG level exceeding 6500 mIU/ml. The absence of a visualized gestational sac at this hCG level raises suspicions of an ectopic pregnancy. Transvaginal ultrasonography, more sensitive than its abdominal counterpart, can detect an ectopic pregnancy approximately 1 week earlier and identifies a gestational sac with a β-hCG level of 1000-1500 mIU/ml. Consequently, the absence of a visualized gestational sac at a β-hCG level exceeding 1500 mIU/ml raises concerns for ectopic pregnancy.
Early diagnosis of ectopic pregnancies allows for the administration of intramuscular methotrexate instead of surgery, leading to the dissolution of the conceptus and enhancing the prospects of future fertility. Serial hCG measurements post-surgical removal aid in detecting the persistence of trophoblastic tissue.
Abortion
The termination of a pregnancy prior to the viability of the fetus (typically before 20 weeks) is termed abortion.
In cases of threatened abortion, there is the presence of vaginal bleeding, yet the internal os remains closed, and the abortion process, though initiated, is still reversible. There exists the possibility that the pregnancy may persevere.
Diagnosis and management of abortion benefit from the utilization of serial quantitative titers of human chorionic gonadotropin (hCG), revealing a lack of the anticipated doubling of hCG levels, along with ultrasonography (USG). These combined approaches contribute to a comprehensive understanding and effective handling of cases involving abortion.
Gestational Trophoblastic Disease (GTD)
This condition is marked by the proliferation of trophoblastic tissue associated with pregnancy. The primary forms of gestational trophoblastic disease (GTD) include hydatidiform (vesicular) mole, which is benign, and choriocarcinoma, which is malignant. The clinical features of GTD encompass:
- A brief history of amenorrhea followed by vaginal bleeding.
- Enlargement of the uterus beyond the corresponding gestational age, characterized by a soft and doughy consistency upon palpation, devoid of fetal parts and fetal heart sounds.
- Excessive nausea and vomiting attributed to elevated human chorionic gonadotropin (hCG) levels.
- The distinctive snowstorm appearance on pelvic ultrasonography (USG).
Quantitative estimation of hCG is useful in both the diagnosis and management of GTD.
Trophoblastic cells in GTD exhibit heightened hCG production compared to those in a normal pregnancy at the equivalent gestational age. The concentration of hCG mirrors the tumor load, and unlike normal pregnancies that reach a plateau by the end of the first trimester, hCG levels in GTD continue to rise beyond 10 weeks of gestation.
Following uterine evacuation, the recommended practice involves weekly hCG estimations until three consecutive results, obtained weekly, return negative. In cases of vesicular mole evacuation, hCG becomes undetectable in approximately 80% of cases within 2-3 months of follow-up. Persistent or rising hCG levels suggest ongoing GTD, prompting the initiation of chemotherapy.
Post-therapy, negative hCG results should undergo regular follow-up every 3 months for 1-2 years to monitor the absence of recurrence. This meticulous monitoring approach ensures comprehensive management and surveillance in cases of GTD.
Laboratory Tests for Human Chorionic Gonadotropin
These are classified into two main groups:
- Biological assays or bioassays
- Immunological assays
Bioassays
In bioassay, the impact of hCG is evaluated using laboratory animals in controlled settings. However, bioassays present several drawbacks, including the necessity for animal facilities, the requirement for animal standardization, prolonged test result timelines, limited sensitivity, and high associated costs. Consequently, immunological assays have emerged as a preferred alternative, supplanting bioassays.
The Ascheim-Zondek test involves the injection of urine from a pregnant woman into immature female mice. A positive outcome is indicated by the development of hemorrhagic corpora lutea in the ovaries after a 4-day period. The Friedman test follows a similar approach, with urine injection, but employs female rabbits instead. In the rapid rat test, the injection of urine containing hCG into female rats induces hyperemia and hemorrhaging in the ovaries. Another distinctive test involves the observation of spermatozoa release from male frogs subsequent to the injection of urine containing hCG.
Immunological Assays
These tests offer rapid and highly sensitive means for detecting and quantifying hCG levels. Variable outcomes arise from distinct immunological tests using the same serum sample, attributed to variations in the specificity of immunoassays for complete hCG, β-subunit, and β-core fragment. A range of commercially available immunological tests employs diverse principles, including agglutination inhibition assay, enzyme immunoassay (such as ELISA), radioimmunoassay (RIA), and immunoradiometric assay.
Among the commonly utilized qualitative urine tests is the agglutination inhibition assay. For optimal results, an early morning urine specimen is preferred due to its elevated hCG concentration. Factors contributing to false-positive results encompass red cells, leukocytes, bacteria, certain drugs, proteins, and an excess of luteinizing hormone (present in menopause or midcycle LH surge) in the urine. Some individuals exhibit anti-mouse antibodies employed in the test, while others harbor hCG-like substances in circulation, leading to false-positive outcomes. These anti-mouse antibodies, known as ‘heterophil’ antibodies, also pose interference in other antibody-based tests. Causes of false-negative results encompass fetal death, abortion, dilute urine, and the low sensitivity inherent in a specific test. Renal failure can result in the accumulation of interfering substances, introducing inaccuracies in test outcomes.
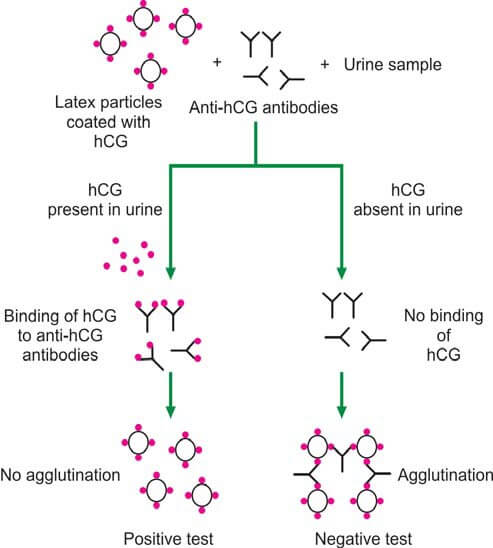
In the latex particle agglutination inhibition test (depicted in Figure 2), patient urine is incubated with anti-hCG antibodies, followed by the addition of hCG-coated latex particles. If hCG is present in the urine, anti-hCG serum is neutralized, preventing latex particle agglutination (yielding a positive test). Conversely, the absence of hCG in urine results in latex particle agglutination (indicating a negative test). This method is commonly implemented as a slide test, offering rapid results within a few minutes.
The agglutination inhibition test boasts a sensitivity exceeding 200 units/liter of hCG. However, radioimmunoassay, enzyme immunoassay, and radioimmunometric assay are recognized for surpassing the agglutination inhibition assay in terms of sensitivity and reliability.
Quantitative tests are useful in detecting very early pregnancy, estimating gestational age, diagnosing ectopic pregnancy, assessing threatened abortion, and managing gestational trophoblastic disease (GTD).
Reference Ranges
- Serum human chorionic gonadotropin:
- Non-pregnant females: <5.0 mIU/ml
- Pregnancy:
- 4 weeks after LMP: 5-100 mIU/ml
- 5 weeks after LMP: 200-3000 mIU/ml
- 6 weeks after LMP: 10,000-80,000 mIU/ml
- 7-14 weeks: 90,000-500,000 mIU/ml
- 15-26 weeks: 5000-80000 mIU/ml
- 27-40 weks: 3000-15000 mIU/ml
Further Reading: Semen Analysis for Investigation of Infertility
- Clinical Pathology
- Pathology
- Pathology Notes
- Notes
- Article
- How to
- Laboratory
- Laboratory Technique
- Laboratory Test Procedure
- Pregnancy Tests Procedures
- Pregnancy Test Instructions
- Pregnancy Testing Method
- Common Testing During Pregnancy
- Procedure for Pregnancy Testing
- Pregnancy Tests and Procedures
- When to Take Pregnancy Tests
- Diseases and Disorders
- Lab Test
Semen Analysis for Investigation of Infertility

Semen, also known as seminal fluid, is a complex fluid discharged from the male genital tract, containing spermatozoa capable of fertilizing female ova. The intricate process of semen production involves several key structures:
- Testes: Male gametes, or spermatozoa, are generated within the testes, constituting 2-5% of the total semen volume.
- Epididymis: Following their production in the testes, spermatozoa undergo maturation and storage in the epididymis. This structure secretes essential components such as potassium, sodium, and glycerylphosphorylcholine—an energy source for sperms.
- Vas Deferens: Spermatozoa travel through the vas deferens to reach the ampulla, another storage site. The ampulla contributes ergothioneine, a yellowish fluid with chemical-reducing properties, and fructose, serving as a nutritional source for spermatozoa.
- Seminal Vesicles: During ejaculation, seminal vesicles and the prostate contribute nutritive and lubricating fluids. Seminal vesicles produce a fluid rich in fructose, amino acids, citric acid, phosphorous, potassium, and prostaglandins, contributing 50% to the overall semen volume.
- Prostate: Approximately 40% of the semen volume is attributed to prostatic secretions. These secretions contain citric acid, acid phosphatase, calcium, sodium, zinc, potassium, proteolytic enzymes, and fibrolysin.
- Bulbourethral Glands of Cowper: These glands secrete mucus, enhancing the lubrication and overall function of the semen.
Box 1: Contributions to semen volume
- Testes and epididymis: 10%
- Seminal vesicles: 50%
- Prostate: 40%
- Cowper’s glands: Small volume
Table 1 and Table 2 display the standard reference values for semen analysis.
| Test | Result |
|---|---|
| Volume | ≥2 ml |
| pH | 7.2 to 8.0 |
| Sperm concentration | ≥20 million/ml |
| Total sperm count per ejaculate | ≥40 million |
| Morphology | ≥30% sperms with normal morphology |
| Vitality | ≥75% live |
| White blood cells | <1 million/ml |
| Motility within 1 hour of ejaculation |
|
| Mixed antiglobuiln reaction (MAR) test | <50% motile sperms with adherent particles |
| Immunobead test | <50% motile sperms with adherent particles |
| Total fructose (seminal vesicle marker) | ≥13 μmol/ejaculate |
| Total zinc (Prostate marker) | ≥2.4 μmol/ejaculate |
| Total acid phosphatase (Prostate marker) | ≥200U/ejaculate |
| Total citric acid (Prostate marker) | ≥52 μmol/ejaculate |
| α-glucosidase (Epididymis marker) | ≥20 mU/ejaculate |
| Carnitine (Epididymis marker) | 0.8-2.9 μmol/ejaculate |
Indications for Semen Analysis
Box 2: Tests done on seminal fluid
- Physical examination: Time to liquefaction, viscosity, volume, pH, color
- Microscopic examination: Sperm count, vitality, motility, morphology, and proportion of white cells
- Immunologic analysis: Antisperm antibodies (SpermMAR test, Immunobead test)
- Bacteriologic analysis: Detection of infection
- Biochemical analysis: Fructose, zinc, acid phosphatase, carnitine.
- Sperm function tests: Postcoital test, cervical mucus penetration test, Hamster egg penetration assay, hypoosmotic swelling of flagella, and computer-assisted semen analysis
The availability of semen for examination provides a unique opportunity for the direct assessment of male germ cells, a capability not paralleled in the examination of female germ cells. Conducting a semen analysis demands a high level of skill and ideally should be carried out in a specialized andrology laboratory.
- Investigation of Infertility: Semen analysis serves as the initial crucial step in exploring cases of infertility. Approximately 30% of infertility cases stem from male-related issues.
- Assessment of Vasectomy Effectiveness: Semen analysis is employed to verify the success of vasectomy by confirming the absence of sperm, ensuring the desired outcome of the procedure.
- Verification or Refutation of Sterility-Related Paternity Denials: Semen analysis plays a pivotal role in supporting or refuting claims of paternity denial based on alleged sterility, contributing valuable insights to legal matters.
- Examination of Medicolegal Cases: Semen analysis is instrumental in examining vaginal secretions or clothing stains for the presence of semen in medicolegal cases, aiding in the determination of crucial forensic evidence.
- Donor Selection for Artificial Insemination: Semen analysis is integral in the selection of donors for artificial insemination, ensuring the quality and viability of sperm for successful reproductive outcomes.
- Assisted Reproductive Technology (ART) Selection: Semen analysis plays a vital role in the selection of assisted reproductive technologies such as in vitro fertilization and gamete intrafallopian transfer technique, contributing to informed decision-making in fertility treatments.
Collection if Semen for Investigation of Infertility
Box 3: Semen analysis for initial investigation of infertility
- Volume
- pH
- Microscopic examination for (i) percentage of motile spermatozoa, (ii) sperm count, and (iii) sperm morphology
A semen specimen is procured following approximately 3 days of sexual abstinence, as this duration optimizes the motility of sperm. Prolonged periods of abstinence can compromise sperm motility, while shorter intervals yield lower sperm counts. The collection process involves masturbation, utilizing a clean, dry, sterile, and leakproof wide-mouthed plastic container. It is imperative to transport the sample to the laboratory within 1 hour of collection.
The entirety of the ejaculate is gathered, with emphasis on the first portion due to its concentrated nature and the highest sperm count. During transit to the laboratory, it is crucial to maintain the specimen as close to body temperature as possible, achieved, for instance, by carrying it in an inside pocket. Ideally, specimen collection should occur near the testing site, preferably in an adjoining room.
Condom collection is discouraged, as it contains spermicidal agents that can impact the integrity of the sample. Ejaculation following coitus interruptus is not advisable, as it results in the loss of the initial concentrated portion of the ejaculate. Therefore, this method should be avoided for specimen collection.
To ensure accuracy and reliability, two semen specimens should be examined, collected 2-3 weeks apart. If there are significant variations in results, additional samples are warranted for a comprehensive assessment.
Examination of Seminal Fluid
Box 2 outlines the various tests applicable to seminal fluid, with a focus on those pertinent to infertility showcased in Box 3. The standard analysis involves assessing semen volume, sperm count, sperm motility, and sperm morphology.
For a comprehensive understanding of the terminology utilized in semen analysis, refer to Box 4. This terminology serves as a crucial reference in the nuanced assessment of seminal fluid, especially in the context of fertility-related investigations.
Examination of Semen to Check the Effectiveness of Vasectomy
Box 4: Terminology in semen analysis
- Normozoospermia: All semen parameters normal
- Oligozoospermia: Sperm concentration <20 million/ml (mild to moderate: 5-20 million/ml; severe: <5 million/ml)
- Azoospermia: Absence of sperms in seminal fluid
- Aspermia: Absence of ejaculate
- Asthenozoospermia: Reduced sperm motility; <50% of sperms showing class (a) and class (b) type of motility OR <25% sperms showing class (a) type of motility.
- Teratozoospermia: Spermatozoa with reduced proportion of normal morphology (or increased proportion of abnormal forms)
- Leukocytospermia: >1 million white blood cells/ml of semen
- Oligoasthenoteratozoospermia: All sperm variables are abnormal
- Necrozoospermia: All sperms are non-motile or non-viable
The objective of post-vasectomy semen analysis is to ascertain the presence or absence of spermatozoa. Standard follow-up protocols involve initiating semen analysis approximately 12 weeks after the vasectomy procedure, or after about 15 ejaculations have occurred. If two consecutive semen samples yield negative results for sperm, the semen is deemed devoid of sperm.
Some recommendations advocate a follow-up semen examination at the 6-month mark to proactively rule out the possibility of spontaneous reconnection. This additional step in the follow-up process contributes to a more thorough and comprehensive assessment of the vasectomy's efficacy.
Further Reading:
- Physical Examination of Semen for Investigation of Infertility
- Biochemical Analysis of Semen for Investigation of Infertility
- Microscopic Examination of Semen for Investigation of Infertility
- Immunologic Analysis of Semen for Investigation of Infertility
- Sperm Function Tests or Functional Assays
- Examination for the Presence of Semen in Medicolegal Cases
Sperm Function Tests or Functional Assays

Examinations of sperm function, also known as functional assays, are exclusively conducted in specialized andrology laboratories. The absence of standardization introduces complexity into result interpretation. When employed individually, a singular sperm function test may not yield significant insights for fertility assessment. However, their predictive efficacy is notably enhanced when utilized in combination.
Postcoital (Sims-Huhner) Test
The Postcoital (Sims-Huhner) Test involves the assessment of cervical mucus following coitus to evaluate the sperm's ability to penetrate the cervical mucus. Cervical mucus quality fluctuates throughout the menstrual cycle, reaching peak abundance and fluidity during ovulation, primarily influenced by estrogen. This increased fluidity facilitates sperm penetration through the mucus. In the secretory phase, progesterone augments mucus viscosity. Therefore, cervical mucus testing is strategically scheduled just before ovulation, determined by basal body temperature records or follicular sizing through ultrasonography.
The Postcoital Test, a traditional method for identifying the cervical factor in infertility, entails aspirating cervical mucus with a syringe shortly before the expected ovulation time and 2-12 hours post-coitus. Gross and microscopic examinations are conducted to evaluate cervical mucus quality, considering elasticity and drying patterns, along with assessing the number and motility of sperm (refer to Box 1). A test is deemed normal if ≥ 10 motile sperms are observed.
An abnormal test may result from factors such as poor cervical mucus quality due to incorrect ovulation judgment, cervicitis, or treatment with antioestrogens (e.g., Clomid). It may also be attributed to the absence of motile sperms, stemming from ineffective coitus technique, lack of ejaculation, poor semen quality, use of coital lubricants harmful to sperm, or the presence of antisperm antibodies. Antisperm antibodies can cause immotile sperms, agglutination, or clumping and may be present in either partner.
If a cervical factor is identified, intrauterine insemination emerges as a popular treatment option. However, the medical literature disputes the definitive value of the postcoital test.
Box 1: Interpretation of postcoital test
- Normal: Sperm count is within the normal range, and the sperm exhibit progressive movement within the mucus. The cervical mucus demonstrates satisfactory elasticity, stretching at least 2 inches (5 cm), and exhibits a fern-like drying pattern.
- Abnormal: Either there is an absence of sperm, a substantial number of sperm are non-viable, or there is clumping of sperm. Additionally, the cervical mucus fails to stretch 2 inches (5 cm) or lacks the characteristic fern-like drying pattern.
This test can be carried out if semen analysis indicates normal parameters, and the female partner is in the ovulatory phase with unobstructed fallopian tubes. Additionally, the test is administered when there is suspicion of antisperm antibodies, and the male partner declines to undergo semen analysis.
Cervical Mucus Penetration Test
The Cervical Mucus Penetration Test involves measuring the maximum distance traveled by sperm in seminal fluid placed and incubated within a capillary tube containing bovine mucus. Typically, the majority of fertile men exhibit a score exceeding 30 mm, whereas most infertile men demonstrate scores below 20 mm.
Hamster Egg Penetration Assay
The Hamster Egg Penetration Assay involves enzymatic treatment of hamster oocytes to eliminate outer layers inhibiting cross-species fertilization. Subsequently, these treated oocytes are incubated with sperm and observed for penetration rates. Results can be reported as either (a) the number of eggs penetrated, with a penetration rate of <15% indicating low fertility, or (b) the number of sperm penetrations per egg, where a normal value is >5. This assay assesses sperm motility, binding to the oocyte, and the penetration of the oocyte. It's important to note a relatively high occurrence of false-negative results associated with this test.
Hypo-osmotic Swelling of Flagella
This examination evaluates the functional integrity of the sperm's plasma membrane by observing the curling response of flagella under hypo-osmotic conditions.
Computer-assisted Semen Analysis
Computer program is used to measure diverse characteristics of spermatozoa; however, its role in predicting fertility potential remains unconfirmed.
Semen Analysis: Immunologic Examination for Infertility Test

The immunologic analysis of semen is a component of the investigation of infertility, and it aims to assess the presence of antibodies that may affect sperm function. Antisperm antibodies (ASA) are immune system proteins that can target and potentially impair sperm function, leading to fertility issues. There are different methods and tests employed in immunologic analysis of semen to detect the presence of these antibodies:
- Direct Sperm Antibody Test (SAT): This test directly measures the presence of antibodies on the surface of sperm. It involves incubating sperm with a substance that binds to antibodies, and the resulting reaction can be detected under a microscope.
- Indirect Sperm Antibody Test (ISAT): This test detects antibodies in the seminal plasma (the fluid part of semen). Serum (blood) is mixed with sperm, and if antibodies are present, they will attach to the sperm. The remaining solution is then tested for the presence of antibodies.
- Mixed Antiglobulin Reaction (MAR) Test: This is another indirect method where sperm are mixed with antibodies that can bind to human antibodies. After washing, the solution is tested to see if any antibodies are attached to the sperm.
- Immunobead Binding Test: In this test, latex beads coated with antibodies are mixed with semen. If there are antisperm antibodies in the semen, they will bind to the latex beads. The bead-sperm complexes can be detected and quantified.
- Flow Cytometry: This technique uses a flow cytometer to analyze individual sperm cells tagged with fluorescent markers. It can provide information on the percentage of sperm affected by antibodies and the degree of binding.
It's important to note that the presence of antisperm antibodies does not always correlate with infertility, and the impact of antibodies on fertility can vary. Additionally, the causes of antisperm antibodies can be diverse, including infections, trauma, or autoimmune disorders. Treatment options may include assisted reproductive technologies (ART) such as in vitro fertilization (IVF) or intrauterine insemination (IUI).
Antisperm Antibodies
The role of antisperm antibodies in the etiology of male infertility remains a subject of debate. Immunological assessments conducted on seminal fluid encompass the mixed antiglobulin reaction (MAR test) and the immunobead test.
Antibodies directed against sperm have the capacity to either immobilize or terminate them, impeding their journey through the cervix to reach the ovum. These antibodies can be examined in the serum, seminal fluid, or cervical mucus. In cases where antibodies are affixed to the head of the sperm, they hinder the sperm from penetrating the egg. Conversely, when antibodies are attached to the tail of the sperm, they impede its motility. This intricate interplay underscores the potential impact of antisperm antibodies on various aspects of sperm function, contributing to the complexities surrounding male infertility.
SpermMAR™ test
The SpermMAR™ test is designed to identify IgG and IgA antibodies targeting the surface of sperm in a semen sample. In the direct SpermMAR™ IgG test, a drop of fresh and unwashed semen is combined with IgG-coated latex particles and anti-human immunoglobulin on a glass slide. A thorough examination of at least 200 motile spermatozoa is conducted. If antibodies are present on the sperm surface, antihuman immunoglobulin binds IgG-coated latex particles to the IgG on the spermatozoa surface. This results in the attachment of latex particles to spermatozoa, observable as motile, swimming spermatozoa with attached particles. Conversely, in the absence of antibodies on the sperm surface, swimming spermatozoa without attached particles are observed, and the latex particles demonstrate clumping due to the binding of their IgG to antihuman immunoglobulin.
In the direct SpermMAR™ IgA test, a drop of fresh unwashed semen and IgA-coated latex particles are mixed on a glass slide. The latex particles bind to spermatozoa if they are coated with IgA antibodies.
The indirect SpermMAR™ tests involve examining fluid without spermatozoa (e.g., serum) for the presence of antisperm antibodies. Initially, antibodies are bound to donor spermatozoa, which are then mixed with the fluid under analysis. These antibodies are subsequently detected as described in the direct tests.
A minimum count of 200 motile spermatozoa is recommended. If more than 50% of spermatozoa exhibit attached latex particles, an immunological issue is likely. This meticulous evaluation through the SpermMAR™ test provides valuable insights into the presence of antisperm antibodies, aiding in the diagnosis of potential immunological factors impacting sperm function.
Immunobead test
The Immunobead test is a diagnostic method aimed at identifying antibodies affixed to the surface of spermatozoa. This is achieved by utilizing immunobeads, which are plastic particles with attached anti-human immunoglobulin (IgG, IgA, or IgM). The procedure involves counting the percentage of motile spermatozoa with two or more attached immunobeads within a sample of 200 motile spermatozoa. An abnormal result is indicated when more than 50% of spermatozoa exhibit attached beads.
This meticulous assessment provides valuable information about the presence of antibodies on the surface of sperm, contributing to a comprehensive understanding of potential immunological factors affecting sperm function. The Immunobead test serves as a crucial tool in the diagnostic arsenal for evaluating male fertility and identifying abnormalities in the immune response against spermatozoa.
Semen Analysis: Microscopic Examination for Infertility Test

Microscopic evaluation of semen stands out as the paramount test for assessing infertility in men. This meticulous analysis, focusing on sperm morphology, motility, and concentration, provides crucial insights into reproductive health. By scrutinizing these parameters, clinicians can identify potential impediments to successful conception. The microscopic assessment not only gauges sperm quality but also reveals any abnormalities that may hinder fertilization. This method is instrumental in acquiring precise data for developing targeted interventions and personalized treatment strategies to address male infertility.
Sperm Motility
In the initial laboratory evaluation of sperm function within a wet preparation, the primary focus is on sperm motility, which denotes the sperms' ability to move. This motility is crucial for tasks such as penetrating cervical mucus, navigating the fallopian tube, and ultimately fertilizing the ovum. It is noteworthy that only sperms exhibiting rapid progressive motility possess the capability to successfully penetrate the ovum and facilitate fertilization.
Principle
In the assessment of sperm within a wet preparation, both motile and non-motile spermatozoa are quantified across randomly selected fields using a 40× objective. The outcome is then articulated as the percentage of observed motile spermatozoa.
Method
On a glass slide, a drop of semen is carefully deposited and overlaid with a coverslip, which is then encircled with petroleum jelly to avert dehydration. Subsequently, the specimen is examined under a 40× objective lens. A minimum of 200 spermatozoa is meticulously enumerated across multiple microscopic fields. The findings are expressed as a percentage, delineating (a) rapidly progressive spermatozoa, characterized by swift linear forward movement; (b) slowly progressive spermatozoa, displaying gradual linear or non-linear motion, such as crooked or curved trajectories; (c) non-progressive spermatozoa, manifesting tail movement without concomitant forward progress; and (d) immotile spermatozoa, exhibiting a complete lack of movement (in accordance with WHO criteria). Spermatozoa falling within grades (c) and (d) are classified as poorly motile (asthenospermia). Typically, a minimum of ≥25% of sperm demonstrates rapid progressive motility, or alternatively, ≥50% collectively showcase rapid progressive and slow progressive motility.
If the percentage of motile spermatozoa is less than 50%, it is essential to assess the proportion of viable sperm by examining an eosin preparation.
Sperm Viability or Vitality
Principle
A cell with an intact cell membrane, considered vital or viable, will remain unstained as it does not take up eosin Y. Conversely, a non-viable or dead cell, with a compromised cell membrane, will absorb the dye, resulting in a pink-red stain (refer to Figure 1). An additional stain, such as nigrosin, may be applied to color the background material. This test is conducted when motility is found to be abnormal.

Method
- Mix one drop of semen with one drop of eosin-nigrosin solution and allow it to incubate for 30 seconds.
- Make a smear from the drop deposited on a glass slide.
- Air-dry the smear and inspect it under an oil-immersion objective. Sperms appearing white are categorized as live or viable, whereas red sperms are classified as dead or non-viable. A minimum of 200 spermatozoa are scrutinized.
- Express the findings as a ratio of viable sperms to non-viable sperms, presented as an integer percentage.
Typically, seventy-five percent or more of spermatozoa are considered to be alive or viable under normal circumstances.
Sperm Count
Principle
The sperm count is conducted post-liquefaction using a counting chamber following appropriate dilution, and the total number of spermatozoa is documented in millions per milliliter (10^6/mL).
Method
- Dilute semen at a ratio of 1:20 with sodium bicarbonate-formalin diluting fluid. To achieve this, take 1 ml of liquefied semen in a graduated tube and fill it with diluting fluid up to the 20 ml mark. Ensure thorough mixing.
- Place a coverslip over the improved Neubauer counting chamber, filling the chamber with the well-mixed diluted semen sample using a Pasteur pipette. Subsequently, position the chamber in a humid box for 10-15 minutes to allow spermatozoa to settle.
- Position the chamber on the microscope stage. Utilizing the 20× or 40× objective and lowering the iris diaphragm adequately for optimal contrast, count the number of spermatozoa in four large corner squares. Consider spermatozoa whose heads touch the left and upper lines of the square as 'belonging' to that square.
- Calculate sperm count per milliliter using the formula:
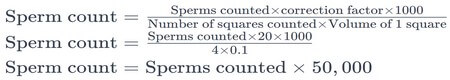
Formula 1: Sperm counting formula. - Sperm count = Sperms counted × correction factor × 1000 ÷ Number of squares counted × Volume of 1 square
Sperm count = Sperms counted × 20 × 1000 ÷ 4 × 0.1
Sperm count = Sperms counted × 50, 000
- Sperm count = Sperms counted × correction factor × 1000 ÷ Number of squares counted × Volume of 1 square
- A normal sperm count is equal to or greater than 20 million per milliliter (i.e., ≥ 20 × 10^6/ml). Sperm counts below 20 million per milliliter may be indicative of male infertility.
Sperm Morphology
To create a smear, a glass slide is used to evenly spread a droplet of seminal fluid, followed by staining. The subsequent step involves counting the percentages of normal and abnormal forms of spermatozoa. Staining techniques employed include Papanicolaou, eosin-nigrosin, hematoxylin-eosin, and Rose Bengal-toluidine blue stain. It is essential to count a minimum of 200 spermatozoa under oil immersion, with the recorded results encompassing the respective percentages of normal and abnormal spermatozoa.
Normal Morphology
Box 1: Normal sperm morphology
- Total length of sperm: About 60 μ
- Total length of sperm: About 60 μ
- Head:
- Length: 3-5 μ
- Width: 2-3 μ
- Thickness: 1.5 μ
- Neck: Length: 0.3 μ
- Middle piece:
- Length: 3-5 μ
- Width: 1.0 μ
- Principal piece:
- Length: 40-50 μ
- Width: 0.5 μ
- End piece: 4-6 μ
A spermatozoon comprises three primary components: the head, neck, and tail. The tail is intricately subdivided into the midpiece, main (principle) piece, and end piece (refer to Figure 2 and Box 1 for visual representation).
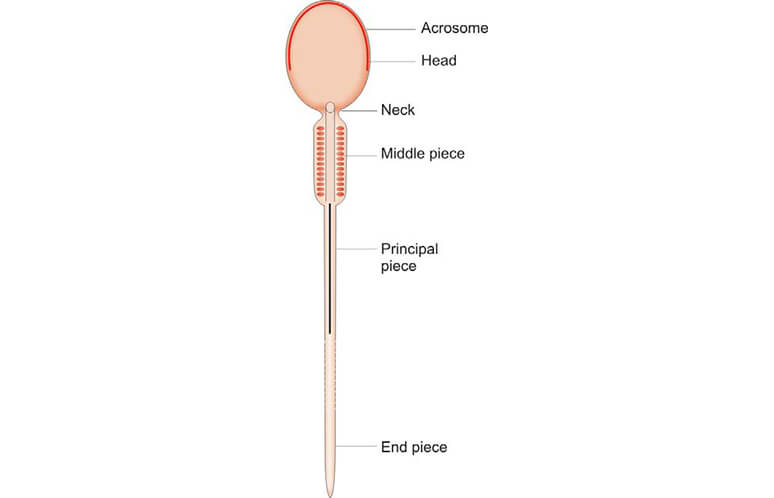
The head of the spermatozoon exhibits a pear-shaped structure. Predominantly, the nucleus occupies most of the head, characterized by condensed chromatin with scattered areas known as nuclear vacuoles. The anterior two-thirds of the nucleus is enveloped by the acrosomal cap, a flattened, membrane-bound vesicle containing glycoproteins and enzymes. These enzymes play a crucial role in the separation of corona radiata cells and the dissolution of the ovum's zona pellucida during the process of fertilization.
The neck serves as a brief segment connecting the head and the tail of the spermatozoon. Within the neck, the centriole gives rise to the axoneme of the flagellum. The axoneme is comprised of 20 microtubules arranged in a specific pattern, with a central pair surrounded by 9 peripheral doublets, and it is enclosed by condensed fibrous rings.
The middle piece, which constitutes the initial portion of the tail, features a central axoneme surrounded by robust longitudinal fibers. These fibers, in turn, are enveloped by elongated mitochondria that play a vital role in supplying energy for the movement of the tail.
The primary or main piece forms the majority of the tail and is comprised of an axoneme surrounded by nine robust fibers. This central core is further encased by numerous circularly arranged fibrous ribs.
The endpiece, a short and tapering section, is exclusively composed of the axoneme.
Typically, more than 30% of spermatozoa should exhibit normal morphology (according to WHO, 1999). Morphological abnormalities associated with male infertility encompass defects such as a faulty mid-piece leading to reduced motility, an incomplete or absent acrosome resulting in an inability to penetrate the ovum, and a giant head indicating defective DNA condensation.
Abnormal Morphology
The World Health Organization's morphological classification of human spermatozoa, as of 1999, is outlined below:
- Normal sperm
- Defects in head:
- Large heads
- Small heads
- Tapered heads
- Pyriform heads
- Round heads
- Amorphous heads
- Vacuolated heads (> 20% of the head area occupied by vacuoles)
- Small acrosomes (occupying < 40% of head area)
- Double heads
- Defects in neck: Bent neck and tail forming an angle >90° to the long axis of head
- Defects in middle piece:
- Asymmetric insertion of midpiece into head
- Thick or irregular midpiece
- Abnormally thin midpiece
- Defects in tail:
- Bent tails
- Short tails
- Coiled tails
- Irregular tails
- Multiple tails
- Tails with irregular width
- Pin heads: Not to be counted
- Cytoplasmic droplets: > 1/3rd the size of the sperm head
- Precursor cells: Considered abnormal

Round Cells
Upon microscopic examination, round cells may be identified as either white blood cells or immature sperm cells. To distinguish between the two, a special stain, such as peroxidase or Papanicolaou, is necessary. An elevated count of white blood cells exceeding 1 million/ml suggests the presence of an infection. Similarly, the detection of a substantial number of immature sperm cells indicates dysfunction in spermatogenesis at the testicular level.
Semen Analysis: Biochemical Examination for Infertility Test

Semen analysis involves the assessment of biochemical markers, as outlined in Table 1, to examine the secretions from various accessory structures. These markers encompass fructose, associated with seminal vesicles; zinc, citric acid, or acid phosphatase, linked to the prostate; and α-glucosidase or carnitine, indicative of epididymal contributions. This comprehensive approach allows for a nuanced evaluation of the diverse components contributing to semen composition, providing valuable insights into the functionality of the reproductive system.
| Total fructose (seminal vesicle marker) | ≥13 μmol/ejaculate |
| Total zinc (Prostate marker) | ≥2.4 μmol/ejaculate |
| Total acid phosphatase (Prostate marker) | ≥200U/ejaculate |
| Total citric acid (Prostate marker) | ≥52 μmol/ejaculate |
| α-glucosidase (Epididymis marker) | ≥20 mU/ejaculate |
| Carnitine (Epididymis marker) | 0.8-2.9 μmol/ejaculate |
Test for Fructose
The Resorcinol method serves as a means for detecting fructose within biological samples. In this analytical procedure, 5 ml of the resorcinol reagent is employed. This reagent is prepared by dissolving 50 mg of resorcinol in 33 ml of concentrated hydrochloric acid, followed by dilution up to 100 ml with distilled water. The resulting solution is then added to 0.5 ml of seminal fluid. Subsequently, the mixture is subjected to heat and brought to a boil. The emergence of a red-colored precipitate within a brief span of 30 seconds signifies the presence of fructose.
The absence of fructose in the test results points towards potential obstructions proximal to the seminal vesicles, which may manifest as either obstructed or absent vas deferens, or an absence of seminal vesicles altogether. In instances of azoospermia, the absence of fructose may be indicative of the obstruction of ejaculatory ducts or the absence of vas deferens. Conversely, the presence of fructose in cases of azoospermia suggests a failure of the testes to produce sperm. This nuanced interpretation allows for a more comprehensive understanding of the underlying factors contributing to the observed test results.
Semen Analysis: Physical Examination for Infertility Test

Examination is conducted subsequent to the liquefaction of semen, typically occurring within 20-30 minutes of ejaculation.
Visual Appearance
Normal semen exhibits a viscous and opaque gray-white appearance. Following extended periods of abstinence, it may display a slight yellow tint.
Viscosity
Immediately after ejaculation, normal semen is characterized by thickness and viscosity. Liquefaction, facilitated by proteolytic enzymes secreted by the prostate, occurs within 30 minutes. Failure of liquefaction within 60 minutes is considered abnormal. The sample's viscosity is evaluated by filling a pipette with semen and observing its flow back into the container. In normal semen, it drips drop by drop. If droplets form ‘threads’ longer than 2 cm, viscosity is heightened. Increased semen viscosity adversely impacts sperm motility, leading to poor invasion of cervical mucus. This condition often results from infections of the seminal vesicles or prostate.
Volume
The volume of ejaculated semen should typically exceed 2 ml and is measured post-liquefaction. A volume less than 2.0 ml is abnormal and is associated with a low sperm count.
pH
A drop of liquefied semen is applied to pH paper with a range of 6.4-8.0, and the pH is recorded after 30 seconds. Normal pH ranges from 7.2 to 8.0 one hour post-ejaculation. The portion of semen contributed by seminal vesicles is basic, while the portion from the prostate is acidic. A low pH (< 7.0) in conjunction with the absence of sperm (azoospermia) suggests an obstruction of ejaculatory ducts or the absence of the vas deferens. Low pH is typically linked to low semen volume, as most of the volume is supplied by seminal vesicles.
Hematuria: Purpose, Test Procedure and Results

The presence of gross hematuria imparts a pink, red, or brown hue to the urine. While the alteration in color may be disconcerting, it's noteworthy that even a minute quantity of blood in the urine can bring about this perceptible change. In most instances, gross hematuria does not elicit pain or other associated symptoms. However, the occurrence of blood clots in the urine may lead to discomfort. Passing blood clots during urination can be a painful experience, and if these clots obstruct the urinary flow, they may result in bladder or back pain.
Conversely, microscopic hematuria, despite not influencing the visible coloration of urine, generally transpires without noticeable symptoms.
Microscopic Examination of Urinary Sediment
Microscopic hematuria is defined as the identification of 3 or more red blood cells per high-power field upon microscopic analysis of urinary sediment in two out of three appropriately collected samples. It is crucial to note that a limited number of red blood cells in low specific gravity urine might undergo lysis, leading to the potential oversight of hematuria if solely relying on microscopic examination. Hence, it is recommended to complement microscopic urine examination with a chemical test for a comprehensive evaluation.
Chemical Tests for the Detection of Blood in Urine
These assays identify both intracellular and extracellular hemoglobin, encompassing intact and lysed red blood cells, as well as myoglobin. Heme proteins within hemoglobin serve as peroxidases, facilitating the reduction of hydrogen peroxide to water. This enzymatic process requires a hydrogen donor, such as benzidine, orthotoluidine, or guaiac. The oxidation of these hydrogen donors initiates the development of color (refer to Figure 1). Importantly, the intensity of the resultant color is directly proportional to the quantity of hemoglobin present.
Positive results from chemical tests are indicative of conditions such as hematuria, hemoglobinuria, and myoglobinuria. These tests play a crucial role in detecting and distinguishing these pathologic states.
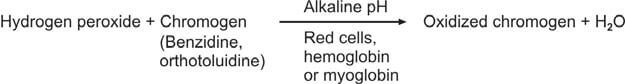
Benzidine Test
Prepare a saturated solution of benzidine in glacial acetic acid. Combine 1 ml of this prepared solution with an equal volume of hydrogen peroxide in a test tube. Introduce 2 ml of urine into the mixture. A positive result is indicated by the development of a green or blue color within 5 minutes.
Orthotoluidine Test
In this assay, orthotoluidine is employed in lieu of benzidine, imparting a heightened sensitivity compared to the benzidine test. This modification enhances the precision and accuracy of the test, making it a more discerning method for the detection of specific reactions.
Reagent Strip Test
Several commercially available reagent strips utilize diverse chromogens, including o-toluidine and tetramethylbenzidine. These strips serve as valuable tools in diagnostic processes, each employing distinct chemical compounds to facilitate precise and reliable results.
Causes of false-positive tests:
- Urine contamination with menstrual blood in females
- Urine contamination due to the presence of oxidizing agents (such as hypochlorite or bleach used for cleaning urine containers) or microbial peroxidase in the context of urinary tract infections.
Causes of false-negative tests:
- Elevated concentrations of a reducing agent, such as ascorbic acid: Microscopic examination reveals the presence of red cells, but the chemical test yields a negative result.
- Utilization of formalin as a urine preservative
Refer to Figure 2 for the illustration of the assessment of a positive chemical test for blood.
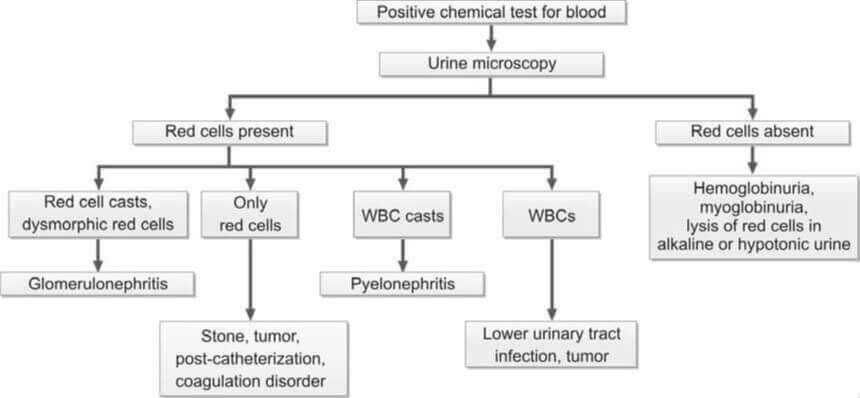
Chemical Urinalysis: Indications, Test Procedure and Results

Urine serves as a diagnostic medium for detecting both physical and biochemical irregularities. This analysis aids in screening and diagnosing conditions such as urinary tract infections, kidney disorders, liver problems, diabetes, and various metabolic conditions. Prior to examination, the specimen's acceptability is assessed.
The chemical examination encompasses the analysis of the following substances in urine:
- Proteins
- Glucose
- Ketones
- Bilirubin
- Bile salts
- Urobilinogen
- Blood
- Hemoglobin
- Myoglobin
- Nitrite or leukocyte esterase
Proteins in Urine
Box 1: Etiologies of proteinuria
- Glomerular proteinuria
- Tubular proteinuria
- Overflow proteinuria
- Hemodynamic (functional) proteinuria
- Post-renal proteinuria
The kidneys typically eliminate a minimal amount of protein in the urine, not exceeding 150 mg in a 24-hour period. These proteins encompass those originating from plasma, such as albumin, as well as proteins derived from the urinary tract, including Tamm-Horsfall protein, secretory IgA, and proteins originating from tubular epithelial cells, leucocytes, and other desquamated cells. Importantly, this level of proteinuria falls below the detection threshold of routine tests.
It's noteworthy that Tamm-Horsfall protein is a normal mucoprotein secreted by the ascending limb of the loop of Henle.
In adults, the term "proteinuria" denotes the excretion of protein in the urine exceeding 150 mg in a 24-hour period.
Causes of Proteinuria
Box 2: Nephrotic syndrome
- Massive proteinuria (>3.5 gm/24 hr)
- Hypoalbuminemia (<3.0 gm/dl)
- Generalised edema
- Hyperlipidemia (serum cholesterol >350 mg/dl)
- Lipiduria
The etiologies of proteinuria can be categorized, as illustrated in Box 1.
- Glomerular Proteinuria: Proteinuria arising from an augmented permeability of the glomerular capillary wall is termed glomerular proteinuria. Within this category, two distinct types exist: selective and nonselective. In the initial stages of glomerular disease, there is an elevated excretion of lower molecular weight proteins such as albumin and transferrin. Selective proteinuria occurs when glomeruli can retain larger molecular weight proteins but allow passage of relatively lower molecular weight proteins. As glomerular damage progresses, selectivity is lost, resulting in the excretion of larger molecular weight proteins, including γ globulins, alongside albumin—termed nonselective proteinuria. The differentiation between selective and nonselective proteinuria can be achieved through urine protein electrophoresis. In selective proteinuria, distinct bands of albumin and transferrin are observable, while in the nonselective type, the pattern mirrors that of serum (Figure 1). Glomerular proteinuria is instigated by diseases affecting the glomerular basement membrane's permeability. The extent of proteinuria corresponds to the severity of the disease and its prognosis. Monitoring the response to treatment is facilitated by serial estimations of urinary protein. The most severe manifestation of proteinuria is observed in nephrotic syndrome (Box 2).
- Tubular Proteinuria: Under normal circumstances, the glomerular membrane, impermeable to high molecular weight proteins, allows the passage of low molecular weight proteins like β2-microglobulin, retinol-binding protein, lysozyme, α1-microglobulin, and free immunoglobulin light chains. These low molecular weight proteins are actively reabsorbed by proximal renal tubules. In diseases predominantly affecting the tubules, these proteins are excreted in urine while albumin excretion remains minimal. Urine electrophoresis reveals prominent α- and β-bands, representing the migration of low molecular weight proteins, and a faint albumin band (Figure 1). Tubular proteinuria is commonly observed in acute and chronic pyelonephritis, heavy metal poisoning, tuberculosis of the kidney, interstitial nephritis, cystinosis, Fanconi syndrome, and kidney transplant rejection. Purely tubular proteinuria is not detectable through reagent strip tests, sensitive to albumin. However, positive results are obtained with the heat and acetic acid test, as well as the sulphosalicylic acid test.
- Overflow Proteinuria: Overflow proteinuria occurs when the concentration of a low molecular weight protein rises in plasma, leading to its "overflow" into the urine. Proteins involved in this type include immunoglobulin light chains or Bence Jones proteins (associated with plasma cell dyscrasias), hemoglobin (resulting from intravascular hemolysis), myoglobin (due to skeletal muscle trauma), and lysozyme (linked to acute myeloid leukemia type M4 or M5).
- Hemodynamic Proteinuria: Changes in blood flow through the glomeruli cause increased protein filtration, although protein excretion is transient. This phenomenon is observed in conditions such as high fever, hypertension, heavy exercise, congestive cardiac failure, seizures, and exposure to cold. Postural (orthostatic) proteinuria occurs when the subject is standing or ambulatory, but is absent in the recumbent position. Common in adolescents (3-5%), it is likely due to a lordotic posture causing inferior vena cava compression between the liver and vertebral column. This condition usually disappears in adulthood, with proteinuria levels below 1000 mg/day. Periodic testing for proteinuria is recommended in such individuals to rule out renal disease.
- Post-renal Proteinuria: This type is induced by inflammatory or neoplastic conditions in the renal pelvis, ureter, bladder, prostate, or urethra.
Further reading: Methods for the Detection of Protein in Urine.
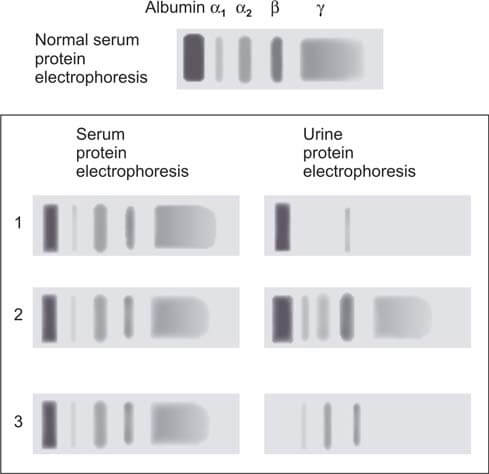
Glucose
Box 3: Urine glucose
- It is advisable to assess urine glucose levels within a 2-hour timeframe following collection. This precaution is necessary due to the enzymatic breakdown of glucose by glycolysis and the presence of contaminating bacteria, which can rapidly degrade glucose.
- The reagent strip test serves as a rapid, cost-effective, and semi-quantitative method for glucose analysis.
- Historically utilized for at-home glucose monitoring, the reagent strip test has been supplanted by more advanced glucometers.
- Urine glucose analysis is unsuitable for monitoring diabetes control. The variability in renal threshold among individuals, the absence of information regarding blood glucose levels below the renal threshold, and the impact of urine concentration on glucose values collectively limit its efficacy for this purpose.
The primary purpose of conducting urine glucose testing is to identify undiagnosed diabetes mellitus or to monitor known diabetic patients during follow-up.
Virtually all glucose that undergoes filtration in the glomeruli is reabsorbed by the proximal renal tubules and subsequently returned to the circulation. Under normal circumstances, only a minute quantity of glucose is excreted in the urine (typically < 500 mg/24 hours or < 15 mg/dl), a level that remains undetectable through routine tests. The presence of discernible quantities of glucose in the urine is termed glucosuria or glycosuria (Box 3). Glycosuria occurs when the filtered glucose load surpasses the reabsorptive capacity of the renal tubules, with hyperglycemia resulting from diabetes mellitus constituting the most prevalent cause.
Causes of Glycosuria
Glycosuria with hyperglycemia
- Endocrine Diseases: Conditions encompassing diabetes mellitus, acromegaly, Cushing's syndrome, hyperthyroidism, and pancreatic disease fall within the realm of endocrine disorders.
- Non-Endocrine Diseases: Central nervous system diseases and liver disorders are among the non-endocrine conditions associated with relevant glycosuric manifestations.
- Drug-Induced Causes: The administration of adrenocorticotrophic hormone, corticosteroids, and thiazides represents drug-related factors contributing to glycosuria.
- Alimentary Glycosuria (Lag-Storage Glycosuria): Following a meal, the swift intestinal absorption of glucose leads to a transient elevation of blood glucose levels beyond the renal threshold. This phenomenon may manifest in individuals with gastrectomy or gastrojejunostomy, as well as those experiencing hyperthyroidism. A glucose tolerance test reveals a peak at 1 hour exceeding the renal threshold, resulting in glycosuria, while fasting and 2-hour glucose values remain within normal limits.
Glycosuria without hyperglycemia
- Renal Glycosuria: Constituting approximately 5% of glycosuria cases in the general population, renal glycosuria is characterized by a renal threshold—the highest blood glucose level at which glucose becomes detectable in urine through routine laboratory tests. The typical renal threshold for glucose is 180 mg/dl. Substances reaching the threshold necessitate a carrier for transport from the tubular lumen to the blood. Once the carrier becomes saturated, the threshold is attained, leading to excretion of the substance. Up to this point, glucose filtered by the glomeruli undergoes efficient reabsorption by the tubules. Renal glycosuria represents a benign condition where the renal threshold is set below 180 mg/dl, yet glucose tolerance remains normal. This disorder is inherited as an autosomal dominant trait. Other instances of glycosuria with blood glucose levels below 180 mg/dl occur in renal tubular diseases, such as Fanconi's syndrome, characterized by diminished glucose reabsorption, and in cases of toxic renal tubular damage. Pregnancy induces a reduction in the renal threshold for glucose, underscoring the importance of blood glucose estimation when the initial detection of glucose in urine occurs.
Further reading: Methods for the Detection of Glucose in Urine.
Ketones
Box 4: Urine ketones in diabetes Indications for testing
- At the initial identification of diabetes mellitus.
- Periodically for individuals with established diabetes and those with gestational diabetes.
- For confirmed diabetic individuals during instances of acute illness, sustained hyperglycemia (>300 mg/dl), pregnancy, and when clinical signs of diabetic acidosis are present (such as nausea, vomiting, and abdominal pain).
The elimination of ketone bodies (specifically, acetoacetic acid, β-hydroxybutyric acid, and acetone) through urine is termed ketonuria. Ketones, derived from the breakdown of fatty acids, appearing in urine signals an elevated level of fatty acid metabolism as a source of energy.
Causes of Ketonuria
Typically, ketone bodies are undetectable in the urine of individuals in good health. When the metabolism of glucose is compromised due to issues such as defective carbohydrate metabolism, insufficient carbohydrate intake, or heightened metabolic demands, the body turns to the breakdown of fats for energy. This metabolic shift results in the production of ketone bodies, as illustrated in Figure 2.
- Reduced Carbohydrate Utilization:
- Uncontrolled Diabetes Mellitus with Ketoacidosis: In the context of diabetes, inadequate glucose utilization triggers compensatory heightened lipolysis. This process elevates the levels of free fatty acids in the plasma. The liver's degradation of these free fatty acids results in the formation of acetoacetyl CoA, subsequently giving rise to ketone bodies. These ketone bodies, potent acids, generate H⁺ ions, neutralized by bicarbonate ions. A decrease in bicarbonate levels (alkali) leads to ketoacidosis. Ketone bodies also augment plasma osmolality, inducing cellular dehydration. Individuals, particularly children and young adults with type 1 diabetes, are predisposed to ketoacidosis during acute illnesses and periods of stress. Presence of glycosuria necessitates ketone body testing. Concurrent presence of glucose and ketone bodies in urine signifies diabetes mellitus with ketoacidosis. In certain diabetes cases, blood ketone levels may rise without manifesting in urine. Detection of ketone bodies in urine can serve as a warning sign of an impending ketoacidotic coma.
- Glycogen Storage Disease (von Gierke’s Disease)
- Insufficient Carbohydrate Availability in the Diet:
- Starvation
- Persistent Vomiting in Children
- Weight Reduction Program (Severe Carbohydrate Restriction with Normal Fat Intake)
- Elevated Metabolic Demands:
- Fever in Children
- Severe Thyrotoxicosis
- Pregnancy
- Protein-Calorie Malnutrition
Further reading: Methods for the Detection of Ketones in Urine.
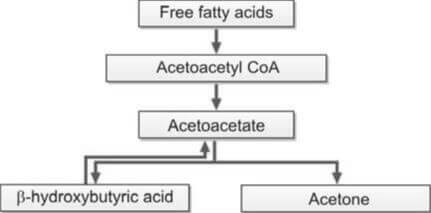
Bile Pigment (Bilirubin)
Bilirubin, a byproduct of hemoglobin breakdown, is typically absent in the urine of healthy individuals. The presence of bilirubin in urine is termed bilirubinuria.
Two distinct forms of bilirubin exist: conjugated and unconjugated. Following its generation from hemoglobin within the reticuloendothelial system, bilirubin circulates in the bloodstream, bound to albumin—referred to as unconjugated bilirubin. Being insoluble in water and bound to albumin, unconjugated bilirubin cannot traverse the glomeruli, and as a result, it does not manifest in the urine.
The liver plays a crucial role in processing unconjugated bilirubin. Here, it combines with glucuronic acid, forming bilirubin diglucuronide, which is categorized as conjugated bilirubin. Unlike its unconjugated counterpart, conjugated bilirubin is water-soluble, undergoes filtration by the glomeruli, and consequently, is excreted in the urine.
The identification of bilirubin in urine, coupled with the presence of urobilinogen, proves valuable in distinguishing various causes of jaundice (refer to Table 1).
| Urine test | Hemolytic jaundice | Hepatocellular jaundice | Obstructive jaundice |
|---|---|---|---|
| Bilirubin | Absent | Present | Present |
| Urobilinogen | Increased | Increased | Absent |
During acute viral hepatitis, bilirubin manifests in urine even prior to the clinical onset of jaundice. In cases of an unexplained fever, the presence of bilirubinuria suggests a potential hepatitis etiology.
The detection of bilirubin in urine signifies the presence of conjugated hyperbilirubinemia, indicative of obstructive or hepatocellular jaundice. This is attributable to the water-solubility of conjugated bilirubin. Conversely, bilirubin does not appear in urine in hemolytic jaundice due to the water-insolubility of unconjugated bilirubin.
Further reading: Methods for the Detection of Bilirubin in Urine.
Bile Salts
Bile salts comprise salts derived from four distinct types of bile acids: cholic, deoxycholic, chenodeoxycholic, and lithocholic. These bile acids combine with either glycine or taurine, forming intricate salts or acids. Transported through the bile, bile salts enter the small intestine, serving as detergents that emulsify fat and reduce surface tension on fat droplets. This action facilitates the enzymatic breakdown of fat by lipases. Following absorption in the terminal ileum, bile salts enter the bloodstream, undergo hepatic uptake, and are subsequently re-excreted in bile, constituting the enterohepatic circulation.
Further reading: Methods for the Detection of Bile Salts in Urine.
Urobilinogen
Conjugated bilirubin, excreted into the duodenum via bile, undergoes bacterial conversion to urobilinogen within the intestine. The majority of this urobilinogen is expelled through feces. A fraction is absorbed into the bloodstream, initiating recycling through the enterohepatic circulation, while a minor quantity, not reabsorbed by the liver, is excreted in urine. Initially colorless, urobilinogen transforms into urobilin upon oxidation, displaying an orange-yellow hue. Typically, 0.5-4 mg of urobilinogen is expelled in urine over 24 hours, resulting in the normal, detectable presence of a small urobilinogen quantity.
The diurnal variation of urobilinogen urinary excretion peaks in the afternoon, emphasizing the preference for a 2-hour post-meal sample for accurate assessment.
Causes of Increased Urobilinogen in Urine
- Hemolysis: The excessive breakdown of red blood cells results in hyperbilirubinemia, leading to an elevated production of urobilinogen in the gastrointestinal tract. Bilirubin, predominantly unconjugated in this scenario, remains absent in urine. Elevated urobilinogen in the absence of bilirubin is characteristic of hemolytic anemia. This phenomenon is also observed in megaloblastic anemia, attributed to the premature destruction of erythroid precursors within the bone marrow—a manifestation of ineffective erythropoiesis.
- Hemorrhage in tissues: The increased bilirubin formation results from the breakdown of red blood cells during tissue hemorrhage.
Causes of Reduced Urobilinogen in Urine
- Obstructive jaundice: When there's an obstruction in the biliary tract, the transport of bilirubin to the intestine is hindered, resulting in minimal or no urobilinogen formation. Consequently, this leads to pale or clay-colored stools.
- Reduction of intestinal bacterial flora: The decrease in the population of intestinal bacterial flora hampers the conversion of bilirubin to urobilinogen within the intestine. This phenomenon is particularly observed in neonates and following antibiotic treatment.
The analysis of urine for both bilirubin and urobilinogen proves to be valuable in assessing a case of jaundice (refer to Table 1 for details).
Further reading: Methods for the Detection of Urobilinogen in Urine.
Blood
The identification of an abnormal quantity of intact red blood cells in urine is termed hematuria. This indicates the existence of a bleeding lesion within the urinary tract. Observable bleeding in urine, either apparent to the naked eye or through macroscopic examination, is referred to as gross hematuria. In cases where bleeding is detectable only through microscopic analysis or chemical tests, it is designated as occult, microscopic, or hidden hematuria.
Causes of Hematuria
1. Diseases of urinary tract:
- Glomerular diseases: Conditions within this category include glomerulonephritis, Berger’s disease, lupus nephritis, and Henoch-Schonlein purpura.
- Nonglomerular diseases: This encompasses a range of conditions such as calculus, tumor, infection, tuberculosis, pyelonephritis, hydronephrosis, polycystic kidney disease, trauma, occurrences after strenuous physical exercise, and diseases of the prostate (benign hyperplasia of the prostate, carcinoma of the prostate).
2. Hematological conditions:
In the context of coagulation disorders and sickle cell disease, the presence of red cell casts, along with proteinuria and hematuria, indicates a glomerular origin of the hematuria.
Further reading: Methods for the Detection of Blood in Urine.
Hemogobin
The condition characterized by the presence of free hemoglobin in the urine is referred to as hemoglobinuria.
Causes of Hemoglobinuria
- Hematuria accompanied by subsequent lysis of red blood cells in urine of low specific gravity.
- Intravascular hemolysis: Hemoglobin becomes evident in the urine when haptoglobin, the plasma protein binding hemoglobin, is fully saturated with hemoglobin. Intravascular hemolysis manifests in various conditions, including severe falciparum malaria, clostridial infections, E. coli septicemia, trauma to red cells (such as march hemoglobinuria, extensive burns, prosthetic heart valves), glucose-6-phosphate dehydrogenase deficiency following exposure to oxidant drugs, immune hemolysis (resulting from mismatched blood transfusion, paroxysmal cold hemoglobinuria), paroxysmal nocturnal hemoglobinuria, hemolytic uremic syndrome, and disseminated intravascular coagulation.
Tests for Detection of Hemoglobinuria
Methods employed to identify hemoglobinuria include the benzidine test, ortho-toluidine test, and reagent strip test.
Hemosiderin
The occurrence of hemosiderin in urine, known as hemosiderinuria, signifies the presence of free hemoglobin in the plasma. Visualization of hemosiderin is achieved through staining urine sediment with Prussian blue stain, revealing blue granules (refer to Figure 3). These granules are situated within tubular epithelial cells or may be present independently if cellular disintegration has occurred. Hemosiderinuria is a characteristic finding in cases of intravascular hemolysis.

Myoglobin
Myoglobin, a protein found in striated muscles (both skeletal and cardiac), serves the function of oxygen binding. Myoglobinuria, the presence of myoglobin in urine, is associated with conditions causing injury to skeletal or cardiac muscles, such as crush injuries, myocardial infarction, dermatomyositis, severe electric shock, and thermal burns.
Chemical tests designed for the detection of blood or hemoglobin also yield a positive reaction with myoglobin, given that both hemoglobin and myoglobin exhibit peroxidase activity. The ammonium sulfate solubility test is employed as a preliminary screening test for myoglobinuria. Notably, myoglobin is soluble in an 80% saturated solution of ammonium sulfate, while hemoglobin remains insoluble and precipitates. A positive chemical test for blood conducted on the supernatant indicates the presence of myoglobinuria.
A comprehensive differentiation between hematuria, hemoglobinuria, and myoglobinuria is detailed in Table 2.
| Parameter | Hematuria | Hemoglobinuria | Myoglobinuria |
|---|---|---|---|
| Urine color | Normal, smoky, red, or brown | Pink, red, or brown | Red or brown |
| Plasma color | Normal | Pink | Normal |
| Urine test based on peroxidase activity | Positive | Positive | Positive |
| Urine microscopy | Many red cells | Occasional red cell | Occasional red cell |
| Serum haptoglobin | Normal | Low | Normal |
| Serum creatine kinase | Normal | Normal | Markedly increased |
Chemical Tests for Significant Bacteriuria (Indirect Tests for Urinary Tract Infection)
In addition to the direct microscopic examination of urine samples, there are commercially available chemical tests in a reagent strip form designed to detect significant bacteriuria. These tests, namely the nitrite test and leucocyte esterase test, prove valuable in settings where urine microscopy is unavailable. A positive result on these tests warrants further investigation through urine culture.
Nitrite Test: Normal urine does not contain nitrites; ingested nitrites are converted to nitrate and excreted. In the presence of gram-negative bacteria (such as E. coli, Salmonella, Proteus, Klebsiella, etc.), these bacteria, through the action of the bacterial enzyme nitrate reductase, reduce nitrates to nitrites. Reagent strip tests then detect the presence of nitrites in urine. Given that E. coli is the predominant organism causing urinary tract infections, the nitrite test serves as a useful screening tool for such infections.
Certain organisms like Staphylococci or Pseudomonas do not convert nitrate to nitrite, resulting in a negative nitrite test in these infections. It's crucial to retain urine in the bladder for a minimum of 4 hours for the conversion of nitrate to nitrite to occur; hence, a fresh early morning specimen is preferred. Adequate dietary intake of nitrate is necessary. Therefore, a negative nitrite test does not conclusively indicate the absence of a urinary tract infection, as the test detects approximately 70% of cases.
Leucocyte Esterase Test: This test identifies the esterase enzyme released in urine from the granules of leucocytes, indicating pyuria. A positive result on this test suggests the need for urine culture. The test is not sensitive to leucocytes fewer than 5 per high-power field.