Displaying items by tag: Diseases and Disorders
CHOLERA: CAUSES, SYMPTOMS, DIAGNOSIS AND TREATMENT

CHOLERA is a specific infectious disease that affects the lower portion of the intestine and is characterized by violent purging, vomiting, muscular cramp, suppression of urine and rapid collapse. It can a terrifying disease with massive diarrhea. The patient’s fluid losses are enormous every day with severe rapid dehydration, death comes within hours.
Total Thyroxine (T4)

Thyroxine, also recognized as T4, is a vital hormone produced by the thyroid gland. It plays a pivotal role in regulating metabolic processes and fostering growth throughout the body.
The presence of T4 in the bloodstream can be categorized into two distinct forms:
- Total T4: This encompasses the entire quantity of thyroxine present in the blood. It includes both the 'bound' T4, which is attached to proteins, and the 'free' T4. The bound T4 is inactive as it is attached to proteins, preventing it from entering body tissues.
- Free T4: This refers exclusively to the unbound portion of T4 that is not attached to proteins. Free T4 is the metabolically active form of the hormone, capable of entering body tissues to exert its effects.
A T4 test is a diagnostic tool that measures the concentration of T4 in your blood. Abnormal levels, either too high or too low, can be indicative of thyroid disease. The measurement of Free T4 is particularly crucial as it reflects the active form of thyroxine hormone available for tissue uptake, thereby providing a more accurate reflection of thyroid function.
The quantification of total serum thyroxine, which encompasses both the free and protein-bound forms, is typically achieved through the application of competitive immunoassay techniques. The standard range for adults is established between 5.0 and 12.0 μg/dl.
It is common practice to conduct a combined analysis of either total or free thyroxine alongside Thyroid Stimulating Hormone (TSH) levels. This combined approach offers the most comprehensive evaluation of thyroid functionality.
Causes of Increased Total T4
- Hyperthyroidism: Primary hyperthyroidism is suggested by the concurrent rise in both T4 and T3 levels, accompanied by a decrease in TSH.
- Augmented Thyroxine-Binding Globulin: An increase in TBG concentration leads to a decrease in free hormone levels, which in turn stimulates the release of TSH from the pituitary, restoring the free hormone concentration to normal. The reverse process occurs if the concentration of binding proteins decreases. In both scenarios, the level of free hormones remains within the normal range, while the concentration of total hormone undergoes changes. Consequently, estimating only the total T4 concentration can lead to misinterpretation of results in situations that alter the concentration of TBG.
- Factitious Hyperthyroidism
- Tumors Secreting TSH in the Pituitary Gland
Causes of Decreased Total T4
- Primary Hypothyroidism: Primary hypothyroidism is characterized by a decrease in T4 levels coupled with an increase in TSH.
- Secondary or Pituitary Hypothyroidism
- Tertiary or Hypothalamic Hypothyroidism
- Hypoproteinemia: This condition, exemplified by the nephrotic syndrome, can lead to a decrease in total T4.
- Pharmaceutical Influence: Certain drugs, such as oestrogen and danazol, can contribute to reduced total T4 levels.
- Severe Non-Thyroidal Illness
Free Thyroxine (FT4)
Free thyroxine (FT4) represents a minuscule fraction of total T4, remains unbound to proteins, and is the metabolically active variant of the hormone. It accounts for approximately 0.05% of total T4. The standard range is 0.7 to 1.9 ng/dl. The concentrations of free hormones (FT4 and FT3) align more accurately with the metabolic state than total hormone levels, as they remain unaffected by fluctuations in TBG concentrations.
The assessment of FT4 proves beneficial in scenarios where the total T4 level is likely to be modified due to changes in TBG level, such as during pregnancy, intake of oral contraceptives, or in the presence of nephrotic syndrome.
Total and Free Triiodothyronine (T3)
Applications
- Diagnosis of T3 Thyrotoxicosis: A condition characterized by hyperthyroidism with diminished TSH and elevated T3, and normal T4/FT4 levels is referred to as T3 thyrotoxicosis.
- Early Detection of Hyperthyroidism: In the initial stages of hyperthyroidism, total T4 and free T4 levels remain within the normal range, but T3 levels are elevated.
A low T3 level does not contribute significantly to the diagnosis of hypothyroidism as it is observed in approximately 25% of healthy individuals.
For routine evaluation of thyroid function, TSH and T4 are measured. T3 is not routinely estimated due to its very low normal plasma levels.
The standard T3 level is 80-180 ng/dl.
Free T3: The measurement of free T3 provides accurate values in patients with altered serum protein levels, such as during pregnancy, intake of estrogens or oral contraceptives, and in the presence of nephrotic syndrome. It represents 0.5% of total T3.
Thyrotropin Releasing Hormone (TRH) Stimulation Test
Applications
- Confirmation of Secondary Hypothyroidism Diagnosis
- Evaluation of Suspected Hypothalamic Disease
- Suspected Hyperthyroidism
This test is not frequently used in current times due to the availability of sensitive TSH assays.
Procedure
- A baseline blood sample is collected for the estimation of basal serum TSH level.
- TRH is administered intravenously (200 or 500 μg), followed by the measurement of serum TSH at 20 and 60 minutes.
Interpretation
- Normal Response: A rise of TSH > 2 mU/L at 20 minutes, followed by a slight decline at 60 minutes.
- Exaggerated Response: A further significant rise in an already elevated TSH level at 20 minutes, followed by a slight decrease at 60 minutes; observed in primary hypothyroidism.
- Flat Response: No response; observed in secondary (pituitary) hypothyroidism.
- Delayed Response: TSH is higher at 60 minutes compared to its level at 20 minutes; seen in tertiary (hypothalamic) hypothyroidism.
Antithyroid Antibodies
Box 1: Thyroid autoantibodies
- Useful for diagnosis and monitoring of autoimmune thyroid diseases.
- Antimicrosomal or antithyroid peroxidase antibodies: Hashimoto’s thyroiditis
- Anti-TSH receptor antibodies: Graves’ disease
In thyroid disorders such as Hashimoto’s thyroiditis and Graves’ disease, various autoantibodies, including TSH receptor, antimicrosomal, and antithyroglobulin, are detected. In almost all patients with Hashimoto’s disease, antimicrosomal (also known as thyroid peroxidase) and anti-thyroglobulin antibodies are observed. TSH receptor antibodies (TRAb) are primarily tested in Graves’ disease to predict the outcome post-treatment.
Radioactive Iodine Uptake (RAIU) Test
This direct test evaluates the trapping of iodide by the thyroid gland (through the iodine symporters or pumps in follicular cells) for thyroid hormone synthesis. Patients are administered a tracer dose of radioactive iodine (either 131I or 123I) orally. This is followed by the measurement of the amount of radioactivity over the thyroid gland at intervals of 2 to 6 hours and again at 24 hours. RAIU directly correlates with the functional activity of the thyroid gland. The normal RAIU is about 10-30% of the administered dose at 24 hours, but this varies according to geographic location due to differences in dietary intake.
Causes of Increased Uptake
Hyperthyroidism due to Graves’ disease, toxic multinodular goiter, toxic adenoma, TSH-secreting tumor.
Causes of Decreased Uptake
Hyperthyroidism due to administration of thyroid hormone, factitious hyperthyroidism, subacute thyroiditis.
Uses
RAIU is most useful in the differential diagnosis of hyperthyroidism by distinguishing causes into those due to increased uptake and those due to decreased uptake.
Thyroid Scintiscanning
An isotope (99mTc-pertechnetate) is administered and a gamma counter assesses its distribution within the thyroid gland.
Interpretation
- Differential diagnosis of high RAIU thyrotoxicosis:
- Graves’ disease: Uniform or diffuse increase in uptake
- Toxic multinodular goiter: Multiple discrete areas of increased uptake
- Adenoma: Single area of increased uptake
- Evaluation of a solitary thyroid nodule:
- ‘Hot’ nodule: Hyperfunctioning
- ‘Cold’ nodule: Non-functioning; about 20% of cases are malignant.
The interpretation of thyroid function tests is shown in Table 1.
| Test results | Interpretations |
|---|---|
| TSH Normal, FT4 Normal | Euthyroid |
| Low TSH, Low FT4 | Secondary hypothyroidism |
| High TSH, Normal FT4 | Subclinical hypothyroidism |
| High TSH, Low FT4 | Primary hypothyroidism |
| Low TSH, Normal FT4, Normal FT3 | Subclinical hyperthyroidism |
| Low TSH, Normal FT4, High FT3 | T3 toxicosis |
| Low TSH, High FT4 | Primary hyperthyroidism |
Neonatal Screening for Hypothyroidism
During the neonatal phase, a deficiency in thyroid hormones can lead to severe mental impairment, a condition known as cretinism. This can be averted through prompt detection and intervention. The Thyroid Stimulating Hormone (TSH) level is typically assessed using dry blood spots on filter paper or cord serum, collected between the 3rd and 5th days of life. An elevated TSH level is indicative of hypothyroidism. For infants diagnosed with hypothyroidism, a Radioactive Iodine Uptake (RAIU) scan using 123I should be performed to differentiate between thyroid agenesis and dyshormonogenesis.
Disorders of Thyroid Gland: Hypothyroidism & Hyperthyroidism
Within the spectrum of endocrine disorders, thyroid-related conditions are prevalent and are second only to diabetes mellitus in terms of frequency. These disorders exhibit a higher incidence in females compared to males. Functional disorders of the thyroid can be bifurcated into two categories based on the gland’s activity level: hypothyroidism, characterized by a deficiency of thyroid hormones, and hyperthyroidism, marked by an overproduction of thyroid hormones. Each of these conditions can stem from a multitude of causes.
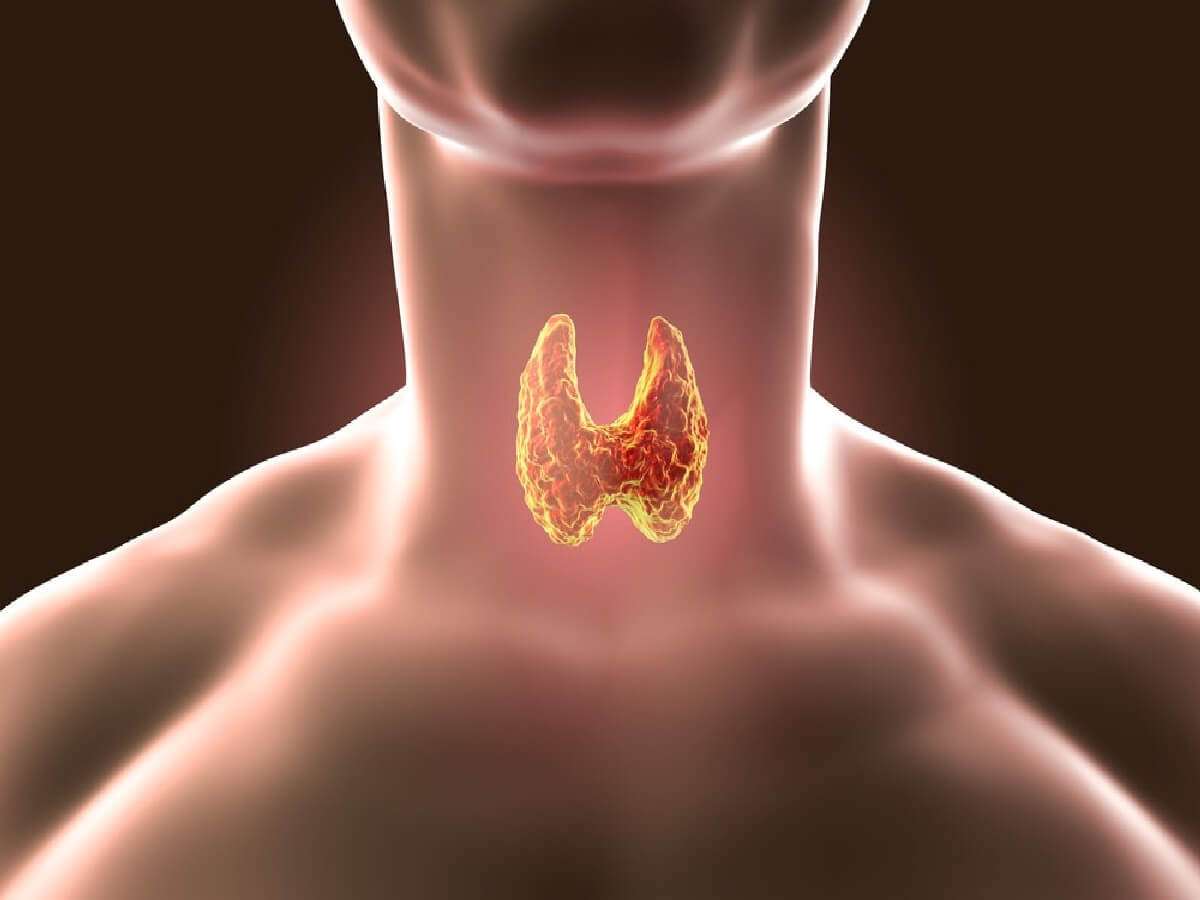
Thyroid disease encompasses a variety of conditions that affect the functionality of the thyroid gland, a crucial component of the endocrine system. This butterfly-shaped gland, nestled at the front of the neck, plays a pivotal role in regulating numerous physiological processes by synthesizing and releasing thyroid hormones, namely thyroxine (T4) and triiodothyronine (T3).
Thyroid disease also encompasses other conditions such as thyroiditis, an inflammatory condition of the thyroid gland; thyroid nodules, which are abnormal growths or lumps on the thyroid gland; goiter, a condition marked by an enlarged thyroid gland; and thyroid cancer.
The proper functioning of the thyroid is integral to the body's overall well-being. Anomalies in thyroid function can have far-reaching effects on various bodily functions, including metabolism, cognitive development, bone health, heart rate regulation, mood stability, and energy levels. Despite the challenges posed by thyroid diseases, they are typically manageable and often treatable with medication, offering a promising prognosis for those affected.
An enlargement of the thyroid gland is referred to as a goiter. The terminology associated with thyroid disorders is delineated in Box 1.
Box 1: Terminology in thyroid disorders
- Primary hyper-/hypothyroidism: Increased or decreased function of thyroid gland due to disease of thyroid itself and not due to increased or decreased levels of TRH or TSH.
- Secondary hyper-/hypothyroidism: Increased or decreased function of thyroid gland due to increased or decreased levels of TSH.
- Tertiary hypothyroidism: Decreased function of thyroid gland due to decreased function of hypothalamus.
- Subclinical thyroid disease: A condition with abnormality of thyroid hormone levels in blood but without specific clinical manifestations of thyroid disease and without any history of thyroid dysfunction or therapy.
- Subclinical hyperthyroidism: A condition with normal thyroid hormone levels but with low or undetectable TSH level.
- Subclinical hypothyroidism: A condition with normal thyroxine and triiodothyronine level along with mildly elevated TSH level.
Hyperthyroidism
Hyperthyroidism is a medical condition precipitated by the overproduction of thyroid hormone. The etiological factors contributing to hyperthyroidism encompass the following:
- Graves' disease, also known as Diffuse Toxic Goiter
- Toxic manifestations in Multinodular Goiter
- Toxicity associated with Adenoma
- Subacute Thyroiditis
- TSH-secreting Pituitary Adenoma, leading to Secondary Hyperthyroidism
- Trophoblastic tumors that secrete a TSH-like hormone, such as Choriocarcinoma and Hydatidiform Mole
- Factitious Hyperthyroidism
Clinical Characteristics
The clinical manifestations of hyperthyroidism encompass a range of symptoms including nervousness, anxiety, irritability, and insomnia, along with the presence of fine tremors. Despite maintaining a normal or even increased appetite, individuals may experience weight loss. Additional symptoms include intolerance to heat, increased perspiration, and dyspnea upon exertion. Reproductive issues such as amenorrhea and infertility may also be present. Cardiovascular symptoms can include palpitations, tachycardia, cardiac arrhythmias, and in elderly patients, heart failure. Musculoskeletal symptoms may manifest as muscle weakness, proximal myopathy, and osteoporosis, particularly in elderly individuals.
Graves' disease, a specific form of hyperthyroidism, is characterized by a triad of symptoms: hyperthyroidism itself, ophthalmopathy (manifesting as exophthalmos, lid retraction, lid lag, corneal ulceration, and impaired eye muscle function), and dermopathy, specifically pretibial myxoedema.
Box 2: Thyroid function tests in hyperthyroidism
- Thyrotoxicosis:
- Serum TSH low or undetectable
- Raised total T4 and free T4.
- T3 toxicosis:
- Serum TSH undetectable
- Normal total T4 and free T4
- Raised T3
Laboratory Features
In the majority of patients, there is an observed elevation in the levels of free serum T3 and T4. In instances of T3 thyrotoxicosis, which accounts for 5% of thyrotoxicosis cases, serum T4 levels remain within normal parameters while T3 levels are elevated. Serum TSH levels are either low or undetectable (less than 0.1 mU/L) as indicated in Box 2.
A condition known as subclinical hyperthyroidism is characterized by undetectable or low serum TSH in conjunction with normal T3 and T4 levels. This condition may present with subtle signs and symptoms of thyrotoxicosis, although this is not always the case. Subclinical hyperthyroidism carries associated risks, including atrial fibrillation, osteoporosis, and the potential progression to overt thyroid disease.
A comparative analysis of the features of primary and secondary hyperthyroidism is presented in Table 1.
| Parameter | Primary hyperthyroidism | Secondary hyperthyroidism |
|---|---|---|
| Serum TSH | Low | Normal or high |
| Serum free thyroxine | High | High |
| TSH receptor antibodies | May be positive | Negative |
| Causes | Graves’ disease, toxic multinodular goiter, toxic adenoma | Pituitary adenoma |
Evaluation of hyperthyroidism is presented in Flowchart 1.
- TSH, FT4
- Low TSH, high FT4
- Primary hyperthyroidism
- TRAb and isotope thyroid scan
- TRAb +ve, Diffuse uptake
- Graves' disease
- TRAb -ve, Nodular uptake
- Toxic adenoma
- TRAb -ve, Irregular uptake
- Toxic multinodular goiter
- TRAb +ve, Diffuse uptake
- TRAb and isotope thyroid scan
- Primary hyperthyroidism
- Low TSH, normal FT4
- Measure FT3
- Normal
- *Subclinical or mild hyperthyroidism
*Non-thyroidal illness
*Drugs (Dopamine, steroids, amiodarone)
- *Subclinical or mild hyperthyroidism
- High
- T3 thyrotoxicosis
- Normal
- Measure FT3
- High TSH, high FT4
- *Pituitary-secreting adenoma (Secondary hyerthroidism)
*Thyroid hormone resistance- TRH test
- Increased response
- Resistance to thyroid hormone
- No response
- Pituitary adenoma
- Increased response
- TRH test
- *Pituitary-secreting adenoma (Secondary hyerthroidism)
- Low TSH, high FT4
Hypothyroidism
Hypothyroidism is a condition caused by deficiency of thyroid hormones. Causes of hypothyroidism are listed below.
- Primary hypothyroidism (Increased TSH)
- Iodine deficiency
- Hashimoto’s thyroiditis
- Exogenous goitrogens
- Iatrogenic: surgery, drugs, radiation
- Secondary hypothyroidism (Low TSH): Diseases of pituitary
- Tertiary hypothyroidism (Low TSH, Low TRH): Diseases of hypothalamus
Primary hypothyroidism is characterized by an insufficiency in thyroid hormone production, which is not attributable to disorders of the hypothalamus or pituitary gland. Secondary hypothyroidism, on the other hand, arises from a deficiency in the secretion of Thyroid Stimulating Hormone (TSH) from the pituitary gland. A deficiency or loss of secretion of thyrotropin-releasing hormone from the hypothalamus results in what is known as tertiary hypothyroidism. Both secondary and tertiary hypothyroidism are significantly less common than primary hypothyroidism. Plasma TSH levels are elevated in primary hypothyroidism and reduced in secondary and tertiary hypothyroidism. The distinctions between primary and secondary hypothyroidism are delineated in Table 2.
| Parameter | Primary hypothyroidism | Secondary hypothyroidism |
|---|---|---|
| Cause | Hashimoto’s thyroiditis | Pituitary disease |
| Serum TSH | High | Low |
| Thyrotropin releasing hormone stimulation test | Exaggerated response | No response |
| Antimicrosomal antibodies | Present | Absent |
Box 3: Thyroid function tests in hypothyroidism
- Primary hypothyroidism
- Serum TSH: Increased (proportional to degree of hypofunction)
- Free T4: Decreased
- TRH stimulation test: Exaggerated response
- Secondary hypothyroidism
- Serum TSH: Decreased
- Free T4: Decreased
- TRH stimulation test: Absent response
- Tertiary hypothyroidism
- Serum TSH: Decreased
- FT4: Decreased
- TRH stimulation test: Delayed response
The clinical manifestations of primary hypothyroidism include lethargy, mild depression, menstrual irregularities, weight gain, intolerance to cold, dry skin, myopathy, constipation, and a firm and lobulated thyroid gland, a characteristic feature of Hashimoto’s thyroiditis.
In severe instances, a condition known as myxoedema coma may occur. This advanced stage is marked by stupor, hypoventilation, and hypothermia.
Laboratory Indicators
The laboratory indicators associated with hypothyroidism are detailed in Box 3.
A condition known as subclinical hypothyroidism is characterized by normal serum thyroxine (T4 and FT4) levels in conjunction with a moderately elevated TSH level (greater than 10 mU/L). This condition is associated with adverse obstetrical outcomes, impaired cognitive development in children, and an increased risk of hypercholesterolemia and progression to overt hypothyroidism.
The evaluation process for hypothyroidism is depicted in Flowchart 2.
- TSH, FT4
- High TSH, low FT4
- Primary hypothyroidism
- Thyroid microsomal antibody
- Increased
- Hashimoto's thyroiditis
- Normal
- *Congenital T4 synthesis deficiency
*Iodine deficiency
- *Congenital T4 synthesis deficiency
- Increased
- Thyroid microsomal antibody
- Primary hypothyroidism
- High TSH, normal FT4
- Subclinical hypothyroidism
- Low TSH, low FT4
- Secondary or tertiary hypothyroidism
- TRH stimulation test
- Little or no TSH response
- Secondary (Pituatary) hypothyroidism
- Delayed TSH response
- Tertiary (Hypothalamic) hypothyroidism
- Little or no TSH response
- TRH stimulation test
- Secondary or tertiary hypothyroidism
- High TSH, low FT4
Female Infertility: Causes and Investigations

Female infertility is a condition characterized by the inability to conceive after 12 months of regular unprotected intercourse, or after 6 months if the woman is over 35. It affects millions globally, impacting individuals, families, and communities. Infertility can be attributed to female factors, male factors, or a combination of both in about two-thirds of cases, with the remaining cases having unknown causes. The primary symptom is the inability to become pregnant. Factors contributing to female infertility include abnormalities in the ovaries, uterus, fallopian tubes, and endocrine system. A menstrual cycle that’s too long (over 35 days), too short (less than 21 days), irregular, or absent may indicate a lack of ovulation, a common cause of infertility. Successful pregnancy requires each step of the human reproduction process to function correctly.
Female Reproductive System
The ovaries serve as the production sites for female gametes, also known as ova, through a process called oogenesis. These ova are cyclically released at regular intervals through ovulation. Each ovary houses a multitude of follicles, each containing ova at different developmental stages.
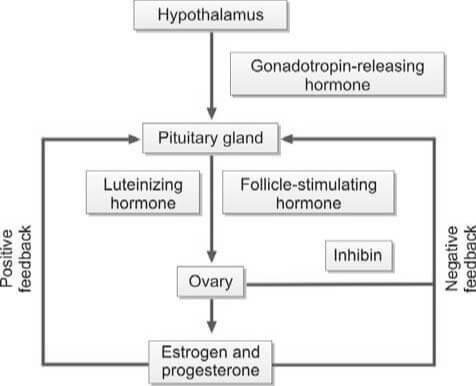
During each menstrual cycle, up to 20 primordial follicles are activated for maturation. However, only one follicle reaches full maturity. This dominant follicle then ruptures to release the secondary oocyte from the ovary. The maturation of the follicle is stimulated by the follicle-stimulating hormone (FSH), which is secreted by the anterior pituitary gland.
As the follicle matures, it secretes estrogen, leading to the proliferation of the endometrium of the uterus, known as the proliferative phase. The follicular cells also secrete inhibin, which regulates the release of FSH by the anterior pituitary. A decrease in FSH levels triggers the secretion of luteinizing hormone (LH) by the anterior pituitary, known as the LH surge. This surge causes the follicle to rupture, expelling the ovum into the peritoneal cavity near the fimbrial end of the fallopian tube.
The fallopian tubes serve as conduits for the ova, transporting them from the ovaries to the uterus. The fertilization of the ovum by the sperm typically occurs within the fallopian tube.
The ovum is composed of the secondary oocyte, the zona pellucida, and the corona radiata. When the follicle in the ovary ruptures, it collapses and fills with a blood clot, forming the corpus luteum. Luteinizing hormone (LH) transforms granulosa cells in the follicle into lutein cells, which begin to secrete progesterone.
Progesterone stimulates secretion from the endometrial glands, marking the secretory phase that was previously influenced by estrogen. As progesterone levels rise, LH production from the anterior pituitary is inhibited. Without LH, the corpus luteum regresses and becomes the non-functional corpus albicans. Following the regression of the corpus luteum, the production of estrogen and progesterone ceases, and the endometrium collapses, initiating menstruation.
If the ovum is fertilized and implants in the uterine wall, the developing placenta secretes human chorionic gonadotropin (hCG) into the maternal circulation. hCG maintains the corpus luteum for the secretion of estrogen and progesterone until the 12th week of pregnancy. After the 12th week, the corpus luteum regresses to the corpus albicans, and the placenta takes over the synthesis of estrogen and progesterone until childbirth.
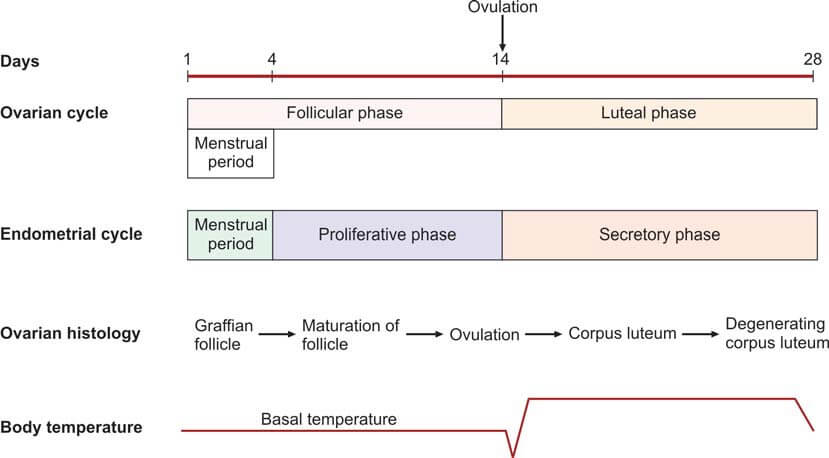
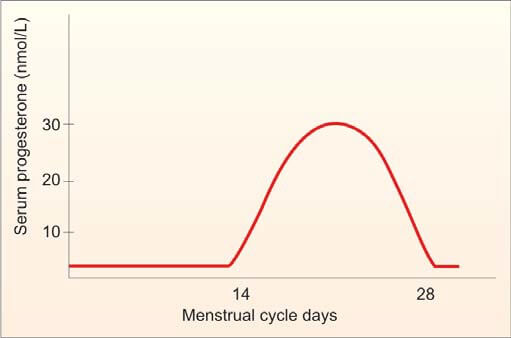
The average duration of a normal menstrual cycle is 28 days, with ovulation typically occurring around the 14th day of the cycle. The interval between ovulation and menstruation, known as the luteal phase, is fairly constant at 14 days.
Factors Contributing to Female Infertility
The following are the primary causes of female infertility:
- Dysfunction of the Hypothalamic-Pituitary Axis:
- Hypothalamic Factors:
- Overexertion through exercise
- High levels of stress
- Underweight conditions
- Kallman's syndrome
- Unexplained causes (Idiopathic)
- Pituitary Factors:
- Hyperprolactinemia
- Hypopituitarism (manifestations include Sheehan's syndrome, Simmond's disease)
- Craniopharyngioma
- Exposure to cerebral irradiation
- Hypothalamic Factors:
- Ovarian Dysfunction:
- Polycystic Ovarian Syndrome (Stein-Leventhal syndrome)
- Luteinized Unruptured Follicle
- Turner's syndrome
- Exposure to radiation or chemotherapy
- Surgical removal of ovaries
- Unexplained causes (Idiopathic)
- Impairment of the Reproductive Tract:
- Fallopian Tubes:
- Infections such as Tuberculosis, Gonorrhea, and Chlamydia
- History of surgical procedures (e.g., laparotomy)
- Tubectomy
- Congenital conditions like hypoplasia or non-canalization
- Endometriosis
- Uterus:
- Uterine malformations
- Asherman's syndrome
- Tuberculous endometritis
- Fibroids
- Cervix: Presence of sperm antibodies
- Vagina: Septum
- Fallopian Tubes:
- Sexual Dysfunction: Dyspareunia
Investigations
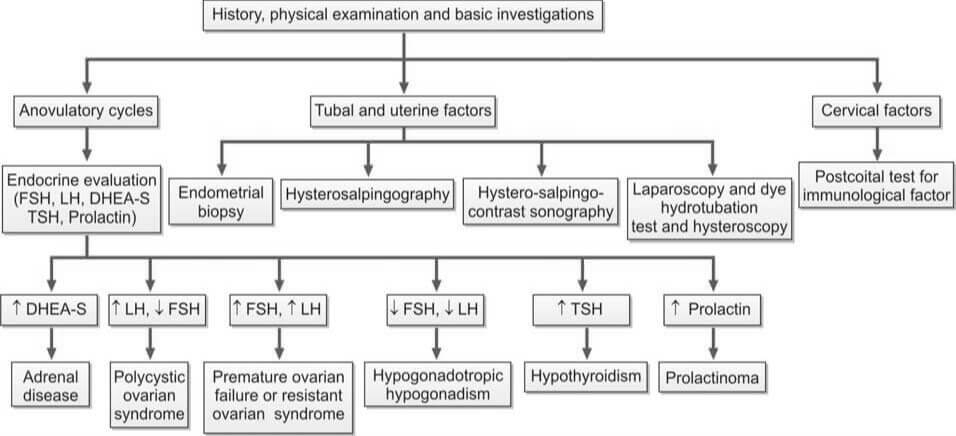
Evaluation of female infertility is shown in Flowchart 2.
Ovulation Testing Methods
Anovulation is the most prevalent cause of female infertility.
- Indicators of Ovulatory Cycles: Regular menstrual cycles, mastalgia, and the direct visualization of the corpus luteum through laparoscopy suggest ovulatory cycles. Anovulatory cycles are clinically manifested by amenorrhea, oligomenorrhea, or irregular menstruation. However, anovulation may still occur in seemingly regular cycles.
- Endometrial Biopsy: This procedure is performed during the premenstrual period (21st-23rd day of the cycle). The presence of a secretory endometrium during the latter half of the cycle serves as evidence of ovulation.
- Ultrasonography (USG): Serial ultrasonography begins from the 10th day of the cycle, measuring the size of the dominant follicle. A size greater than 18 mm suggests imminent ovulation. The collapse of the follicle and the presence of a few milliliters of fluid in the pouch of Douglas indicate ovulation. USG is also useful for treatment purposes (i.e., timing of coitus or intrauterine insemination) and diagnosing a luteinized unruptured follicle (absence of dominant follicle collapse). Transvaginal USG is more sensitive than abdominal USG.
- Basal Body Temperature (BBT): The patient measures her oral temperature at the same time every morning before getting up. A drop of about 0.5°F at the time of ovulation is observed. During the second (progestational) half of the cycle, the temperature slightly rises above the preovulatory level (increase of 0.5° to 1°F). This rise is due to the slight pyrogenic action of progesterone and thus serves as presumptive evidence of a functional corpus luteum.
- Cervical Mucus Study:
- Fern Test: During the estrogenic phase, a characteristic fern pattern appears when cervical mucus is spread on a glass slide. This ferning disappears after the 21st day of the cycle. If previously observed, its disappearance is presumptive evidence of corpus luteum activity.
- Spinnbarkeit Test: Cervical mucus is elastic and can stretch up to a distance of over 10 cm. This phenomenon, known as Spinnbarkeit or the thread test, indicates estrogen activity. During the secretory phase, the viscosity of the cervical mucus increases, and it fractures when stretched. This change in cervical mucus is evidence of ovulation.
- Vaginal Cytology: The Karyopyknotic Index (KI) is high during the estrogenic phase and decreases in the secretory phase. This index refers to the percentage of superficial squamous cells with pyknotic nuclei to all mature squamous cells in a lateral vaginal wall smear. Typically, a minimum of 300 cells are evaluated. The peak KI usually corresponds with the time of ovulation and may reach up to 50 to 85.
- Estimation of Progesterone in Mid-Luteal Phase (day 21 or 7 days before expected menstruation): A progesterone level greater than 10 nmol/L is a reliable indicator of ovulation if cycles are regular. An improperly timed sample is a common cause of abnormal results.

Diagnostic Procedures for Anovulation
The following tests are performed to identify the cause of anovulation:
- Measurement of LH, FSH, and Estradiol Levels (Days 2 to 6): In cases of hypogonadotropic hypogonadism, which is a result of hypothalamic or pituitary failure, all these values are typically low.
- Measurement of TSH, Prolactin, and Testosterone Levels (If Cycles are Irregular or Absent):
- Increased TSH Levels: This is indicative of hypothyroidism.
- Increased Prolactin Levels: This could suggest the presence of a pituitary adenoma.
- Increased Testosterone Levels: This could be a sign of Polycystic Ovarian Disease (PCOD) or Congenital Adrenal Hyperplasia. To differentiate between PCOD and Congenital Adrenal Hyperplasia, an ultrasound and estimation of dihydroepiandrosterone (DHEA) are performed.
- Transvaginal Ultrasonography: This procedure is conducted to detect the presence of PCOD.
Evaluating Tubal and Uterine Health
The following investigations are conducted to assess the status of the fallopian tubes and uterus:
- Infectious Disease Testing: This includes an endometrial biopsy for tuberculosis and a test for Chlamydial IgG antibodies to determine the tubal factor in infertility.
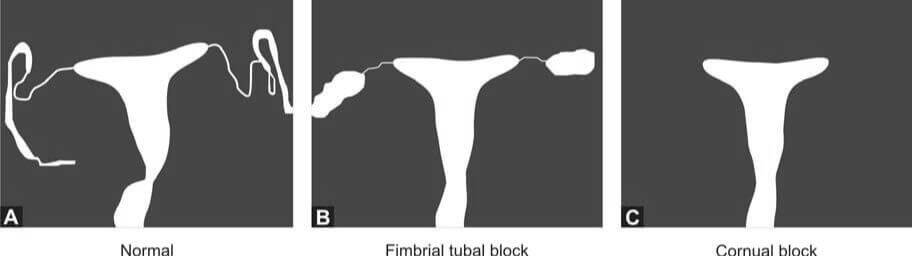
- Hysterosalpingography (HSG): HSG is a radiological contrast study used to examine the shape of the uterine cavity and to detect any blockage in the fallopian tubes. A catheter is inserted into the cervical canal, and a radiocontrast dye is injected into the uterine cavity. Real-time X-ray imaging is then performed to observe the flow of the dye into the uterine cavity, tubes, and its spillage into the uterine cavity.
- Hysterosalpingo-Contrast Sonography: In this procedure, a catheter is introduced into the cervical canal, and an echocontrast fluid is injected into the uterine cavity. The shape of the uterine cavity, the filling of the fallopian tubes, and the spillage of the contrast fluid are observed. Additionally, an ultrasound scan of the pelvis provides information about any existing fibroids or polycystic ovarian disease.
- Laparoscopy and Dye Hydrotubation Test with Hysteroscopy: This test involves inserting a cannula into the cervix and introducing methylene blue dye into the uterine cavity. If the tubes are patent, the dye will be observed spilling from the ends of both tubes. This technique also allows for the visualization of pelvic organs, endometriosis, and pelvic adhesions. If necessary, endometriosis and tubal blockage can be treated during the procedure.
Please note that potential pregnancy and active pelvic or vaginal infection are contraindications to tubal patency tests.
Male Infertility: Causes and Investigations

Male infertility is a health condition that impedes a man's ability to initiate a pregnancy with his female partner. This condition is often associated with complications in sperm production or the creation of healthy sperm. It can also be linked to functional issues that affect the sperm's capacity to fertilize an egg. The causes of male infertility are multifaceted and can include hormonal imbalances, genetic disorders like cystic fibrosis, problems with the testes, and blockages in the genital tract. Environmental factors, lifestyle choices such as smoking or excessive alcohol consumption, infections, certain medications, and sexual dysfunction can also contribute to male infertility. A comprehensive medical evaluation by a specialist, such as a urologist or reproductive endocrinologist, is typically required for accurate diagnosis and effective treatment of this condition.
Male Reproductive System
The male reproductive system is a complex network of organs and structures that work in harmony to ensure the production, maturation, and delivery of spermatozoa.
- Testes: These paired organs, nestled within the scrotal sac, serve as the epicenter of male reproductive function. Their dual role involves both sperm production (spermatogenesis) and the secretion of testosterone—the quintessential male hormone. The testes are home to specialized cells called Leydig cells, which diligently manufacture testosterone.
- Ductal System:
- Epididymis: A coiled tube adjacent to each testis, the epididymis plays a pivotal role in sperm maturation. It provides a nurturing environment for spermatozoa, allowing them to gain motility and acquire the ability to fertilize an egg.
- Vasa Deferentia: These paired ducts extend from the epididymis and serve as conduits for sperm transport. They propel sperm toward their ultimate destination—the ejaculatory ducts.
- Ejaculatory Ducts: These tubes, formed by the union of the vasa deferentia and seminal vesicles, facilitate the release of sperm during ejaculation. Their intricate coordination ensures the efficient delivery of spermatozoa.
- Accessory Glands:
- Seminal Vesicles: Paired and strategically positioned near the base of the bladder, the seminal vesicles contribute significantly to seminal fluid composition. Their secretions provide nourishment and energy to sperm, enhancing their chances of survival.
- Prostate Gland: Singular and walnut-sized, the prostate gland adds its own unique blend to the seminal fluid. Its contributions include enzymes and substances that aid in liquefying semen post-ejaculation.
- Bulbourethral Glands of Cowper: These small glands, often overlooked, secrete a lubricating mucus. This mucus serves as a prelude to ejaculation, ensuring smooth passage for sperm through the urethra.
- Penis: The external organ of copulation, the penis plays a dual role: it houses the urethra (through which urine and semen exit) and serves as the conduit for sexual intercourse.
- Hormonal Regulation:
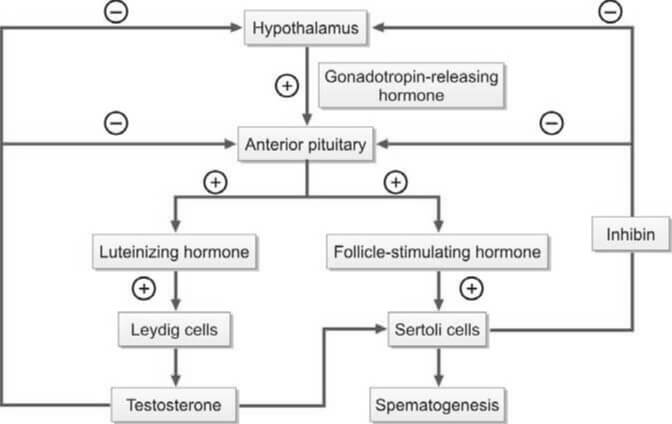
- Gonadotropin-Releasing Hormone (GnRH): Produced by the hypothalamus, GnRH orchestrates the delicate dance of hormonal regulation. It stimulates the anterior pituitary gland to release two crucial gonadotropins: luteinizing hormone (LH) and follicle-stimulating hormone (FSH).
- Luteinizing Hormone (LH): LH's primary target is the Leydig cells within the testes. Upon activation, these cells ramp up testosterone production, essential for spermatogenesis and the development of secondary sexual characteristics.
- Testosterone: This powerhouse hormone not only fuels sperm production but also influences muscle mass, bone density, and libido. Intriguingly, testosterone undergoes conversion to dihydrotestosterone (DHT) within cells, enabling it to exert its androgenic effects.
- Follicle-Stimulating Hormone (FSH): Acting on Sertoli cells within the seminiferous tubules, FSH fine-tunes the maturation process of spermatozoa. These same Sertoli cells also produce inhibin, which, in a neat feedback loop, regulates FSH secretion.
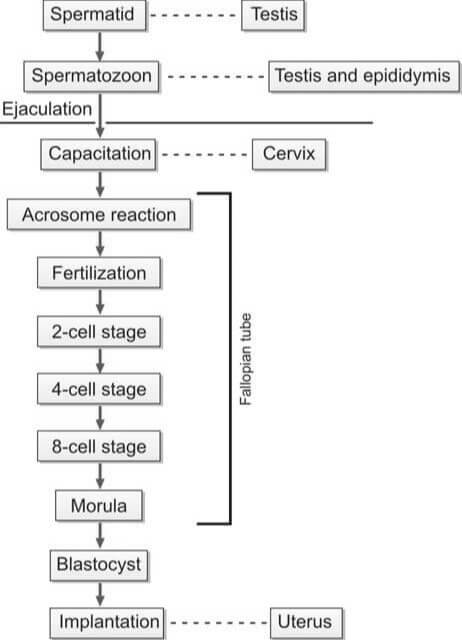
During the act of copulation, seminal fluid is introduced into the female's vagina. This semen undergoes a process known as liquefaction within a span of 20 to 30 minutes, facilitated by the proteolytic enzymes present in the prostatic fluid. For successful in vivo fertilization, the spermatozoa must experience capacitation and the acrosome reaction.
Capacitation is a term that describes the physiological transformations that sperm undergo as they traverse the cervix of the female reproductive tract. Through this process, the sperm gain the ability to (i) initiate the acrosome reaction, (ii) bind to the zona pellucida, and (iii) exhibit hypermotility. The sperm then journey through the cervix and uterus, eventually reaching the fallopian tube.
The binding of the sperm to the zona pellucida triggers the acrosomal reaction, which involves the breakdown of the outer plasma membrane by acrosomal enzymes and its fusion with the outer acrosomal membrane, resulting in the loss of the acrosome. This step is crucial for the fusion of the sperm and oocyte membranes.
Following the acrosomal reaction and the binding of sperm and ovum surface proteins, the sperm penetrates the zona pellucida of the ovum. After a sperm has penetrated, the zona pellucida hardens, preventing further penetration by additional sperm. The fertilization of the egg by the sperm typically occurs in the ampullary section of the fallopian tube.
Factors Contributing to Male Infertility
Male infertility is a complex issue that arises from a multitude of factors that can impact sperm production, motility, or function. It’s often rooted in hormonal imbalances, genetic disorders such as Klinefelter syndrome, and testicular complications including trauma or cancer. Environmental influences, including exposure to harmful toxins, can also play a part. Lifestyle choices, such as smoking, excessive alcohol consumption, and obesity, significantly contribute to male infertility. Furthermore, infections, certain medications, and sexual dysfunction can also be contributing factors. To accurately identify the specific cause, a comprehensive medical evaluation by a urologist or reproductive specialist is typically necessary. Understanding the root cause is the first step towards effective treatment and management of male infertility.
The following are the various factors that can contribute to male infertility:
- Idiopathic: This refers to cases where the cause of infertility remains unknown.
- Hypothalamic-Pituitary Dysfunction (Hypogonadotropic Hypogonadism): This condition involves a disruption in the communication between the hypothalamus and pituitary gland, leading to decreased production of sex hormones.
- Testicular Dysfunction: This category includes a variety of factors:
- Exposure to radiation, cytotoxic drugs, antihypertensives, and antidepressants.
- General factors such as stress, emotional factors, substance abuse (including marijuana, anabolic steroids, and cocaine), alcoholism, heavy smoking, and undernutrition.
- Post-puberty mumps orchitis.
- Varicocele, which is the dilation of the pampiniform plexus of scrotal veins.
- Cryptorchidism, or undescended testes.
- Endocrine disorders such as diabetes mellitus and thyroid dysfunction.
- Genetic disorders including Klinefelter’s syndrome, microdeletions in the Y chromosome, autosomal Robertsonian translocation, immotile cilia syndrome (Kartagener’s syndrome), cystic fibrosis, and defects in the androgen receptor gene.
- Dysfunction of Passages and Accessory Sex Glands: This includes:
- Infections of the epididymis caused by tuberculosis, gonorrhea, or Chlamydia.
- Congenital bilateral absence of the vasa deferentia (often associated with cystic fibrosis) or vasectomy.
- Prostatitis, or inflammation of the prostate gland.
- Dysfunction of Sexual Act: This encompasses:
- Impotence or erectile dysfunction.
- Ejaculation defects such as retrograde ejaculation (where semen is pumped backwards into the bladder), premature ejaculation, or absence of ejaculation.
- Hypospadias, a condition where the opening of the urethra is on the underside of the penis rather than at the tip.
Examination Procedures for Male Infertility
The following are the various procedures involved in the investigation of male infertility:
- Patient History: This encompasses the individual's lifestyle (including heavy smoking and alcohol consumption), sexual habits, instances of erectile dysfunction, ejaculation patterns, history of sexually transmitted diseases, any surgeries performed in the genital area, medication usage, and any systemic illnesses.
- Physical Examination: This involves a thorough examination of the reproductive system, including the size of the testicles, presence of undescended testes, hypospadias, and any scrotal abnormalities such as varicocele. It also includes an assessment of body and facial hair. Varicocele, which can occur bilaterally, is the most common surgically correctable abnormality causing male infertility.
- Semen Analysis: Please refer to the article on Semen Analysis for more information. The evaluation of azoospermia and low semen volume are depicted in Flowcharts 3 and 4, respectively.
- Chromosomal Analysis: This test can identify conditions such as Klinefelter’s syndrome (e.g., XXY karyotype), deletions in the Y chromosome, and autosomal Robertsonian translocations. If there is a bilateral congenital absence of the vas deferens, screening for the cystic fibrosis carrier state is necessary.
- Hormonal Studies: These involve the measurement of FSH, LH, and testosterone levels to detect any hormonal abnormalities that could lead to testicular failure.
- Testicular Biopsy: A testicular biopsy is recommended when it is not clear whether azoospermia is obstructive or non-obstructive (i.e., normal FSH levels and normal testicular volume).
| Follicle stimulating hormone | Luteinizing hormone | Testosterone | Interpretation |
|---|---|---|---|
| Low | Low | Low | Hypogonadotropic hypogonadism (Hypothalamic or pituitary disorder) |
| High | High | Low | Hypergonadotropic hypogonadism (Testicular disorder) |
| Normal | Normal | Normal | Obstruction of passages, dysfunction of accessory glands |
- Azoospermia (on two separate occasions)
- Normal-sized testes
- Obstructive azoospermia
- Epididymal obstruction by chlamydia or gonorrhea
- Vasectomy
- Congenital bilateral absence of vas
- Genetic testing for cyctic fibrosis gene
- Obstructive azoospermia
- Small or soft testes
- Non-obstructive azoospermia
- Hormonal analysis
- FSH, LH, testosterone levels low
- Hypogonadotropic hypogonadism
- FSH, LH high; testosterone level normal or low
- Primary testicular failure
- Genetic studies for Klinefelter's syndrome
- Primary testicular failure
- FSH, LH, testosterone levels low
- Hormonal analysis
- Non-obstructive azoospermia
- Normal-sized testes
- Semen volume <1ml
- Examination of post-ejaculatory urine
- Positive for sperms
- Retrograde ejaculation
- Negative for sperms
- Transrectal ultrasonography for seminal vesicle abnormality and ejaculatory duct obstruction
- Positive for sperms
- Examination of post-ejaculatory urine

The following are the standard preliminary examinations typically conducted to determine the cause of infertility:
- Semen Analysis: This is a comprehensive examination of a man's semen and sperm to assess fertility.
- Blood Glucose: This test measures the level of glucose (sugar) in the blood and can indicate potential health issues.
- Endocrine Tests: These tests measure the levels of specific hormones in the blood, such as Follicle Stimulating Hormone (FSH), Luteinizing Hormone (LH), and testosterone, which play crucial roles in reproduction.
LABORATORY TESTS FOR GASTRIC ANALYSIS

Hollander’s test (Insulin hypoglycemia test):
In the past, this test was used for confirmation of completeness of vagotomy (done for duodenal ulcer). Hypoglycemia is a potent stimulus for gastric acid secretion and is mediated by vagus nerve. This response is abolished by vagotomy.
In this test, after determining BAO, insulin is administered intravenously (0.15-0.2 units/kg) and acid output is estimated every 15 minutes for 2 hours (8 post-stimulation samples). Vagotomy is considered as complete if, after insulin-induced hypoglycemia (blood glucose < 45 mg/dl), no acid output is observed within 45 minutres.
The test gives reliable results only if blood glucose level falls below 50 mg/dl at some time following insulin injection. It is best carried out after 3-6 months of vagotomy.
The test is no longer recommended because of the risk associated with hypoglycemia. Myocardial infarction, shock, and death have also been reported.
Fractional test meal:
In the past, test meals (e.g. oat meal gruel, alcohol) were administered orally to stimulate gastric secretion and determine MAO or PAO. Currently, parenteral pentagastrin is the gastric stimulant of choice.
Tubeless gastric analysis:
This is an indirect and rapid method for determining output of free hydrochloric acid in gastric juice. In this test, a cationexchange resin tagged to a dye (azure A) is orally administered. In the stomach, the dye is displaced from the resin by the free hydrogen ions of the hydrochloric acid. The displaced azure A is absorbed in the small intestine, enters the bloodstream, and is excreted in urine. Urinary concentration of the dye is measured photometrically or by visual comparison with known color standards. The quantity of the dye excreted is proportional to the gastric acid output. However, if kidney or liver function is impaired, false results may be obtained. The test is no longer in use.
Spot check of gastric pH:
According to some investigators, spot determination of pH of fasting gastric juice (obtained by nasogastric intubation) can detect the presence of hypochlorhydria (if pH>5.0 in men or >7.0 in women).
Congo red test during esophagogastroduodenoscopy:
This test is done to determine the completeness of vagotomy. Congo red dye is sprayed into the stomach during esophagogastroduodenoscopy; if it turns red, it indicates presence of functional parietal cells in stomach with capacity of producing acid.
REFERENCE RANGES
- Volume of gastric juice: 20-100 ml
- Appearance: Clear
- pH: 1.5 to 3.5
- Basal acid output: Up to 5 mEq/hour
- Peak acid output: 1 to 20 mEq/hour
- Ratio of basal acid output to peak acid output: <0.20 or < 20%
CONTRAINDICATIONS TO GASTRIC ANALYSIS
- Gastric intubation for gastric analysis is contraindicated in esophageal stricture or varices, active nasopharyngeal disease, diverticula, malignancy, recent history of severe gastric hemorrhage, hypertension, aortic aneurysm, cardiac arrhythmias, congestive cardiac failure, or non-cooperative patient.
- Pyloric stenosis: Obstruction of gastric outlet can elevate gastric acid output due to raised gastrin (following antral distension).
- Pentagastrin stimulation is contraindicated in cases with allergy to pentagastrin, and recent severe gastric hemorrhge due to peptic ulcer disease.
- It is an invasive and cumbersome technique that is traumatic and unpleasant for the patient.
- Information obtained is not diagnostic in itself.
- Availability of better tests for diagnosis such as endoscopy and radiology (for suspected peptic ulcer or malignancy); serum gastrin estimation (for ZE syndrome); vitamin assays, Schilling test, and antiparietal cell antibodies (for pernicious anemia); and tests for Helicobacter pylori infection (in duodenal or gastric ulcer).
- Availability of better medical line of treatment that obviates need for surgery in many patients.
Indications for Gastric Analysis

Gastric analysis involves the assessment of the quantity of acid produced by the stomach through the analysis of aspirated gastric juice samples. The estimation of gastric acid output encompasses both the baseline (basal) and the maximum (peak) levels achieved after the stimulation of parietal cells. Originally introduced primarily for evaluating peptic ulcer disease and determining the necessity for surgical intervention, the test’s significance has diminished over time. This decline is attributed to the decreased prevalence of peptic ulcer disease and the widespread availability of safe and efficacious medical treatments, thereby diminishing the prominence of surgical interventions.
Gastric analysis is a diagnostic procedure assessing the composition and activity of gastric juices, is employed in various clinical scenarios. Indications for gastric analysis include:
- To determine the cause of recurrent peptic ulcer disease:
- To detect Zollinger-Ellison (ZE) syndrome: Zollinger-Ellison (ZE) syndrome stands as a rare pathology characterized by the development of multiple mucosal ulcers in the stomach, duodenum, and upper jejunum, attributed to a pronounced hypersecretion of stomach acid. This excessive acid secretion finds its roots in a gastrin-producing tumor originating in the pancreas. The diagnostic journey for ZE syndrome often involves gastric analysis, aiming to identify significantly heightened basal and pentagastrin-stimulated gastric acid outputs. Additionally, a more nuanced and specific diagnostic approach leverages the measurement of serum gastrin levels, both in the fasting state and under secretin stimulation. This multifaceted diagnostic strategy not only aids in confirming ZE syndrome but also plays a crucial role in assessing the responsiveness to acid-suppressant therapies.
- To decide about completeness of vagotomy following surgery for peptic ulcer disease: The Hollander’s Test, also known as the Hollander-Wolff test, is a medical procedure used to evaluate gastric acid secretion. This test involves the administration of a histamine analog, typically histalog, to stimulate the release of gastric acid. The patient undergoes gastric analysis, and the acid output is measured in response to histalog stimulation. The Hollander’s Test is particularly valuable in assessing the function of parietal cells in the stomach, which are responsible for acid production. This procedure aids in diagnosing conditions related to gastric acid secretion, such as peptic ulcer disease or Zollinger-Ellison syndrome. During the test, gastric juice is aspirated, and the acid output is analyzed before and after the administration of histalog. It is used for the management and treatment of various gastrointestinal disorders. See Hollander’s test.
- To determine the cause of raised fasting serum gastrin level: Elevated levels of gastrin, known as hypergastrinemia, may manifest in various clinical conditions such as achlorhydria, Zollinger-Ellison syndrome, and antral G cell hyperplasia.
- To support the diagnosis of pernicious anemia (PA): Pernicious anemia stems from the impaired absorption of vitamin B12, resulting from the breakdown in intrinsic factor synthesis due to gastric mucosal atrophy. This condition is further marked by the absence of hydrochloric acid in the gastric juice, a state referred to as achlorhydria. In cases where facilities for vitamin assays and Schilling’s test are unavailable, gastric analysis becomes a valuable tool for demonstrating achlorhydria. It is crucial to note, however, that achlorhydria alone is insufficient for the definitive diagnosis of pernicious anemia.
- To distinguish between benign and malignant ulcer: Excessive acid secretion characterizes duodenal peptic ulcers, whereas gastric carcinoma is associated with a deficiency in acid production known as achlorhydria. However, anacidity is observed only in a limited number of cases involving advanced gastric cancer. Additionally, it’s worth noting that increased acid output is not universally present in all individuals with duodenal ulcers.
- To measure the amount of acid secreted in a patient with symptoms of peptic ulcer dyspepsia but normal X-ray findings: Excess acid secretion in such cases is indicative of duodenal ulcer. However, hypersecretion of acid does not always occur in duodenal ulcer.
- To decide the type of surgery to be performed in a patient with peptic ulcer: Elevated basal and peak acid outputs signify an augmentation in parietal cell mass, suggesting the necessity for gastrectomy. Conversely, an elevated basal acid output coupled with a normal peak output serves as an indicator for vagotomy.
Method of Gastric Analysis

To evaluate gastric acid secretion, the stomach's acid output is measured both in a fasting state and post the administration of a stimulating drug. The Basal Acid Output (BAO) represents the quantity of hydrochloric acid (HCl) secreted without external stimuli (visual, olfactory, or auditory). The Maximum Acid Output (MAO) quantifies the HCl secreted by the stomach when stimulated by pentagastrin, calculated from the initial four 15-minute samples post-stimulation. For assessing the greatest possible acid secretory capacity, the Peak Acid Output (PAO) is derived from the two highest consecutive 15-minute samples, preferred for its enhanced reproducibility. The acidity level is determined through titration methods.
Collection of Sample
All medications influencing gastric acid secretion, including antacids, anticholinergics, cholinergics, H2-receptor antagonists, antihistamines, tranquilizers, antidepressants, and carbonic anhydrase inhibitors, must be withheld for 24 hours before the examination. Proton pump inhibitors require discontinuation 5 days prior to the test. To ensure accurate results, patients should be in a relaxed state, devoid of any sensory stimulation sources.
No food or drink is allowed after midnight preceding the test. Gastric juice can be obtained through an oral or nasogastric tube, either during endoscopy or through aspiration.
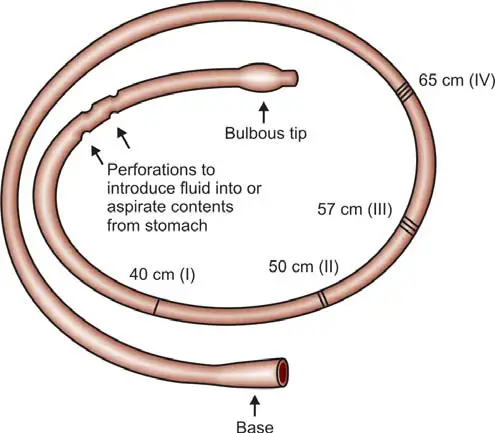
The commonly used oral or nasogastric tube (depicted in Figure 1) is a flexible, narrow-diameter tube with a weighted bulbous end, facilitating gastric juice entry through perforations. Its radiopaque feature allows precise positioning in the stomach's most dependent part under fluoroscopic or X-ray guidance. Lubricated for ease, the tube can be introduced via the mouth or nose while the patient is seated or reclined on the left side. Markings on the tube's outer surface correspond to distances from the teeth: 40 cm (tip to cardioesophageal junction), 50 cm (body of stomach), 57 cm (pyloric antrum), and 65 cm (duodenum). Tube placement can be verified by fluoroscopy or the ‘water recovery test’, where the recovery of over 90% of introduced water indicates proper placement. Typically, the tube is positioned in the antrum, and a syringe is attached for gastric juice aspiration.
For BAO Estimation: Samples are collected in the morning after a 12-hour overnight fast. Initial gastric secretion accumulated overnight is aspirated and discarded. Subsequently, gastric secretions are aspirated at 15-minute intervals for 1 hour, resulting in a total of 4 consecutive samples. All samples undergo centrifugation to remove particulate matter. Each 15-minute sample is analyzed for volume, pH, and acidity. The acid output in the four samples is totaled and expressed as the concentration of acid in milliequivalents per hour or in mmol per hour.
After Gastric Juice Collection for BAO Determination: Following this, the patient receives a subcutaneous or intramuscular injection of pentagastrin (6 μg/kg of body weight). Immediately afterward, gastric secretions are aspirated at 15-minute intervals for 1 hour for the estimation of MAO or PAO. MAO is calculated from the first four 15-minute samples after stimulation, while PAO is derived from two consecutive 15-minute samples showing the highest acidity.
Titration
Box 1: Determination of basal acid output, maximum acid output, and peak acid output
- Basal acid output (BAO) = Total acid content in all four 15-minute basal samples in mEq/L
- Maximum acid output (MAO) = Total acid content in all four 15-minute post-pentagastrin samples in mEq/L
- Peak acid output (PAO) = Sum of two consecutive 15-minute post-pentagastrin samples showing highest acidity ×2 (mEq/L)
Gastric acidity assessment involves titration, where the endpoint is determined by observing the change in color of the indicator solution or reaching the desired pH.
In this process, 0.1 N sodium hydroxide, an alkali solution, is incrementally added from a graduated vessel (burette) to a known volume of acid (gastric juice) until the equivalence point of the reaction is achieved. The concentration of acid is then determined based on the concentration and volume of alkali required for neutralizing the specific volume of gastric juice. Acid concentration is expressed in milliequivalents per liter or mmol per liter.
Free acidity signifies the concentration of HCl present in a free, uncombined form in the solution. The volume of alkali added to the gastric juice until Topfer’s reagent (an earlier-added indicator) changes color or when the pH reaches 3.5 is a measure of free acidity. A screening test for free HCl in gastric juice involves observing a red color after adding Topfer’s reagent to an aliquot. The presence of free HCl excludes the diagnosis of pernicious anemia (achlorhydria).
Combined acidity encompasses HCl combined with proteins and mucin, including small amounts of weak acids in gastric juice.
Total acidity is the summation of free and combined acidity. The amount of alkali added to gastric juice until phenolphthalein indicator (previously added to the gastric juice) changes color is indicative of total acidity (Box 1).
Interpretation of Results
- Volume: Normal total volume is 20-100 ml (usually < 50 ml). Causes of increased volume of gastric juice are—
- Color: Normal gastric secretion is colorless, with a faintly pungent odor. Fresh blood (due to trauma, or recent bleeding from ulcer or cancer) is red in color. Old hemorrhage produces a brown, coffee-ground like appearance (due to formation of acid hematin). Bile regurgitation produces a yellow or green color.
- pH: Normal pH is 1.5 to 3.5. In pernicious anemia, pH is greater than 7.0 due to absence of HCl.
- Basal acid output:
- Normal: Up to 5 mEq/hour.
- Duodenal ulcer: 5-15 mEq/hour.
- Zollinger-Ellison syndrome: >20 mEq/hour.
- Peak acid output:
- Normal: 1-20 mEq/hour.
- Duodenal ulcer: 20-60 mEq/hour.
- Zollinger-Ellison syndrome: > 60 mEq/hour.
- Achlorhydria: 0 mEq/hour.
- Normal PAO is seen in gastric ulcer and gastric carcinoma. Values up to 60 mEq/hour can occur in some normal individuals and in some patients with Zollinger-Ellison syndrome.
- In pernicious anemia, there is no acid output due to gastric mucosal atrophy. Achlorhydria should be diagnosed only if there is no free HCl even after maximum stimulation.
- Ratio of basal acid output to peak acid output (BAO/PAO):
- Normal: < 0.20 (or < 20%).
- Gastric or duodenal ulcer: 0.20-0.40 (20-40%).
- Duodenal ulcer: 0.40-0.60 (40-60%).
- Zollinger-Ellison syndrome: > 0.60 (> 60%).
- Normal values occur in gastric ulcer or gastric carcinoma.
Alterations in gastric acid output are linked to various conditions, as outlined in Table 1.
Importantly, the values of acid output, while significant, should not be considered diagnostic in isolation. Correlation with clinical, radiological, and endoscopic features is essential for a comprehensive evaluation.
| Increased gastric acid output | Decreased gastric acid output |
|---|---|
|
|
- Pathology
- Clinical Pathology
- Pathology Notes
- Notes
- Article
- How to
- Method of Gastric Analysis
- Gastric Analysis Method
- Laboratory
- Laboratory Technique
- Laboratory Test Procedure
- Diseases and Disorders
- Method for Combined Gastrointestional Feeding and Aspiration
- Gastric Aspiration
- Gastric Problems
- Gastric Ulcer
Microscopic Examination of Feces
Microscopic examination of feces is a crucial diagnostic tool in identifying various infections and conditions related to the gastrointestinal tract. This process involves studying small samples of fecal material under a microscope to detect the presence of parasites, eggs, larvae, and other microorganisms.
Microscopic examinations done on fecal sample are shown in Flowchart 1.
- Microscopic examination of feces
- Direct wet mount
- For Eggs/larvae of helminths and trophozoites/cysts of protozoa
- If negative, concentration technique
- For Eggs/larvae of helminths and trophozoites/cysts of protozoa
- Special stains
- (A) Trichrome stain for indentification of trophozoites and cysts
(B) AFB stain for oocysts of Cryptosporidium Cyclospora, and Isospora
(C) Wright's stain for white blood cells
- (A) Trichrome stain for indentification of trophozoites and cysts
- Cellophane technique
- For eggs of Enterobius vermicularis
- Direct wet mount
Collection of Specimen for Parasites
Collect a small amount of stool (at least 4 ml or 4 cm³) in a clean container with a tight lid, like a tin box, plastic box, glass jar, or waxed cardboard box. Take 20-40 grams of formed stool or 5-6 tablespoons of watery stool. Make sure it's not mixed with urine, water, soil, or menstrual blood. Trophozoites of Entameba histolytica degrade quickly, so bring the sample to the lab immediately. Parasites are best seen in warm, fresh stools, so examine them within an hour of collection. If there's a delay, refrigerate the sample. Use a fixative with 10% formalin or polyvinyl alcohol if transporting to another lab.
Getting one negative result for parasites doesn't mean there's no infection. To be thorough, take three samples on separate days, with a 3-day gap.
For accurate results, the patient should avoid oily laxatives, antidiarrheal meds, bismuth, tetracycline antibiotics, or antacids for a week before the stool exam. Also, no barium swallow examination.
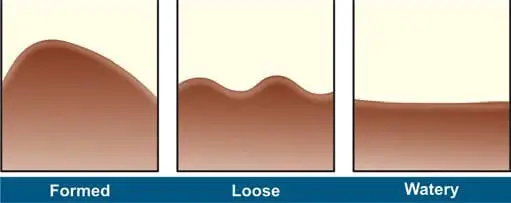
In the lab, check the stool for consistency (watery, loose, soft, or formed), color, odor, and the presence of blood, mucus, adult worms, or tapeworm segments. See Figure 1 for details.
Color/Appearance of Fecal Specimens
- Brown: Normal
- Black: Bleeding in upper gastrointestinal tract (proximal to cecum), Drugs (iron salts, bismuth salts, charcoal)
- Red: Bleeeding in large intestine, undigested tomatoes or beets
- Clay-colored (gray-white): Biliary obstruction
- Silvery: Carcinoma of ampulla of Vater
- Watery: Certain strains of Escherichia coli, Rotavirus enteritis, cryptosporidiosis
- Rice water: Cholera
- Unformed with blood and mucus: Amebiasis, inflammatory bowel disease
- Unformed with blood, mucus, and pus: Bacillary dysentery
- Unformed, frothy, foul smelling, which float on water: Steatorrhea.
Preparation of Slides
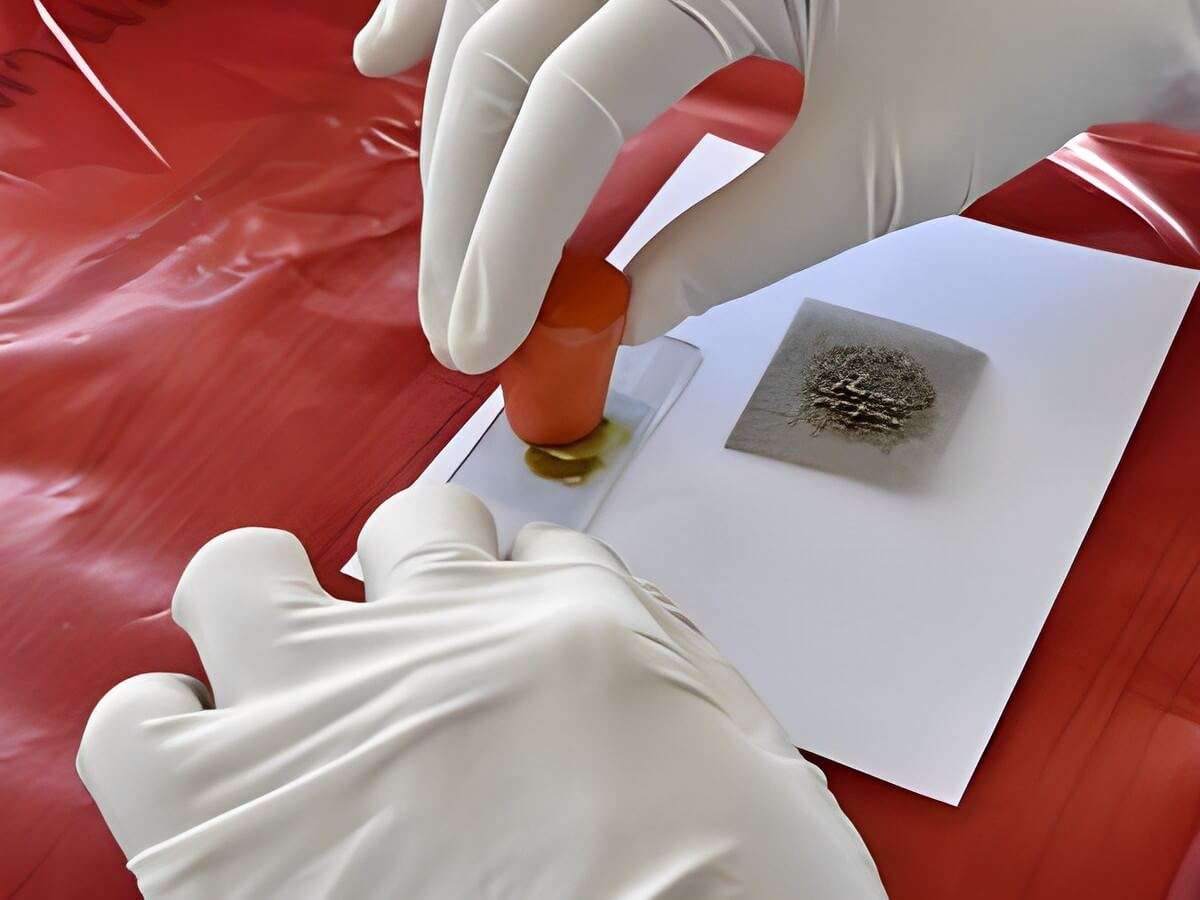
In the lab, we make saline and iodine wet mounts of the sample (see Figure 2).
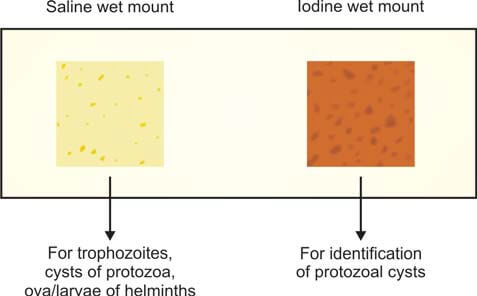
Here's how it's done: On a glass slide, put a drop of normal saline on one end and a drop of Lugol iodine solution on the other. Take a small bit of feces (about the size of a match-head) and mix it with a drop each of saline and iodine, using a wire loop. Cover each preparation with a cover slip. If there's blood or mucus in the specimen, include that part for examination (trophozoites are often found in mucus). If the stools are liquid, pick the surface portion for examination.
The saline wet mount helps show eggs, larvae of helminths, and trophozoites and cysts of protozoa. It can also detect red and white cells. Iodine stains glycogen and nuclei of cysts. The iodine wet mount is handy for identifying protozoal cysts. Trophozoites stop moving in iodine mounts. If the stool is liquid or diarrheal, you can check it directly without adding saline.
Concentration Procedure
If there are only a few parasites, concentrating the fecal specimen helps. But, it's a trade-off—while it makes it harder to detect amebic trophozoites, it's necessary when wet mount examination doesn't find anything, and there's a suspicion of a parasitic infection. This method is useful for spotting ova, cysts, and larvae of parasites.
There are two main types of concentration techniques:
- Sedimentation techniques: Ova and cysts settle at the bottom, but too much debris can make it tricky to find parasites. For example, there's the Formolethyl acetate sedimentation procedure.
- Floatation techniques: Ova and cysts float on the surface, but not all of them float in this method. Examples include the Saturated salt floatation technique and zinc sulphate concentration technique.
The commonly used sedimentation method is the Formol-ethyl acetate concentration method because:
- It can detect eggs, larvae of almost all helminths, and cysts of protozoa.
- It preserves their shape well.
- It's rapid.
- There's minimal risk of infection for lab workers because formalin kills pathogens.
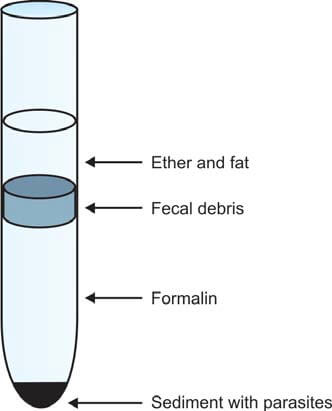
Here's how it works: Make a fecal suspension in 10% formalin (10 ml formalin + 1 gram feces). Pass it through a gauze filter until you get 7 ml of filtered material. Add ethyl acetate (3 ml), then centrifuge the mixture for 1 minute. Eggs, larvae, and cysts settle at the bottom (see Figure 3). Remove the layers above the deposit—formalin, fecal debris, and ether. Loosen the debris, pour off the supernatant, and place a drop of sediment on each end of a glass slide. Stain one drop with iodine, cover slips, and examine it under the microscope.
Classification of Intestinal Parasites of Humans
Humans' intestinal parasites fall into two main groups: protozoa and metazoa (helminths) (see Flowchart 2).
- Intestinal parasites
- Protozoa
- Amebae: Entamoeba histolytica
Flagellates: Gardia lamblia
Ciliates: Balantidium coli
Coccidia: Isospora belli, Cryptosporidium parvum, Cyclospora cayetanensis
Microsporidia
- Amebae: Entamoeba histolytica
- Helminths
- Nemathelminthes
- Ascaris lumbricoides
Enterobius vermicularis
Ancylostoma duodenale
Necator americanus
Strongyloides stercoralis
Trichuris trichiura
- Ascaris lumbricoides
- Platyhelminthes
- Trematodes
- Fasciolopsis buski
- Cestodes
- Taenia saginata
Taenia solium
Hymenolepis nana
Diphyllobothrium latum
- Taenia saginata
- Trematodes
- Nemathelminthes
- Protozoa
Summary
Microscopic examination of feces is a crucial diagnostic tool in identifying various infections and conditions related to the gastrointestinal tract. This process involves studying small samples of fecal material under a microscope to detect the presence of parasites, eggs, larvae, and other microorganisms.
Procedure
- Sample Collection: A small amount of stool is collected and prepared for examination. The sample should be free from contamination with urine, water, or soil.
- Wet Mount Preparation: The sample is mixed with normal saline or iodine solution on a glass slide. This helps in observing live organisms and provides information on their motility and characteristics.
- Concentration Techniques: In some cases, concentration methods are used to increase the chances of detecting parasites. Sedimentation and floatation techniques are common, helping to separate parasites from fecal debris.
- Microscopic Observation: The prepared slides are examined under a microscope. The pathologist looks for parasites, cysts, eggs, larvae, and other relevant structures. The examination may also include assessing the color, consistency, and presence of blood or mucus.
Significance
- Parasitic Infections: Microscopic examination helps identify a wide range of parasitic infections, including protozoa and helminths.
- Disease Diagnosis: It aids in diagnosing conditions such as amoebiasis, giardiasis, and various helminth infections.
- Treatment Monitoring: Monitoring the presence of parasites is essential to track the effectiveness of treatment and ensure the elimination of the infection.
In Brief
Microscopic examination of feces is a valuable tool in the hands of pathologists to diagnose and monitor gastrointestinal infections. It allows for a detailed analysis of the fecal sample, aiding in the timely and accurate identification of parasites and other microscopic elements that may indicate an underlying health issue.
CHEMICAL EXAMINATION OF FECES
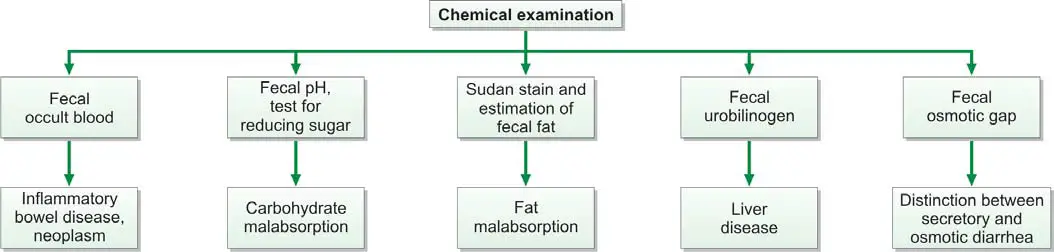
Chemical examination of feces is usually carried out for the following tests (Figure 845.1):
- Occult blood
- Excess fat excretion (malabsorption)
- Urobilinogen
- Reducing sugars
- Fecal osmotic gap
- Fecal pH
Test for Occult Blood in Stools
Presence of blood in feces which is not apparent on gross inspection and which can be detected only by chemical tests is called as occult blood. Causes of occult blood in stools are:
- Intestinal diseases: hookworms, amebiasis, typhoid fever, ulcerative colitis, intussusception, adenoma, cancer of colon or rectum.
- Gastric and esophageal diseases: peptic ulcer, gastritis, esophageal varices, hiatus hernia.
- Systemic disorders: bleeding diathesis, uremia.
- Long distance runners.
Occult blood test is recommended as a screening procedure for detection of asymptomatic colorectal cancer. Yearly examinations should be carried out after the age of 50 years. If the test is positive, endoscopy and barium enema are indicated.
Tests for detection of occult blood in feces: Many tests are available which differ in their specificity and sensitivity. These tests include tests based on peroxidase-like activity of hemoglobin (benzidine, orthotolidine, aminophenazone, guaiac), immunochemical tests, and radioisotope tests.
Tests Based on Peroxidase-like Activity of Hemoglobin
Principle: Hemoglobin has peroxidase-like activity and releases oxygen from hydrogen peroxide. Oxygen molecule then oxidizes the chemical reagent (benzidine, orthotolidine, aminophenazone, or guaiac) to produce a colored reaction product.
Benzidine and orthotolidine are carcinogenic and are no longer used. Benzidine test is also highly sensitive and false-positive reactions are common. Since bleeding from the lesion may be intermittent, repeated testing may be required.
Causes of False-positive Tests
- Ingestion of peroxidase-containing foods like red meat, fish, poultry, turnips, horseradish, cauliflower, spinach, or cucumber. Diet should be free from peroxidase-containing foods for at least 3 days prior to testing.
- Drugs like aspirin and other anti-inflammatory drugs, which increase blood loss from gastrointestinal tract in normal persons.
Causes of False-negative Tests
- Foods containing large amounts of vitamin C.
- Conversion of all hemoglobin to acid hematin (which has no peroxidase-like activity) during passage through the gastrointestinal tract.
Immunochemical Tests
These tests specifically detect human hemoglobin. Therefore there is no interference from animal hemoglobin or myoglobin (e.g. meat) or peroxidase-containing vegetables in the diet.
The test consists of mixing the sample with latex particles coated with anti-human haemoglobin antibody, and if agglutination occurs, test is positive. This test can detect 0.6 ml of blood per 100 grams of feces.
Radioisotope Test Using 51Cr
In this test, 10 ml of patient’s blood is withdrawn, labeled with 51Cr, and re-infused intravenously. Radioactivity is measured in fecal sample and in simultaneously collected blood specimen. Radioactivity in feces indicates gastrointestinal bleeding. Amount of blood loss can be calculated. Although the test is sensitive, it is not suitable for routine screening.
Apt test: This test is done to decide whether blood in the vomitus or in the feces of a neonate represents swallowed maternal blood or is the result of bleeding in the gastrointestinal tract. The test was devised by Dr. Apt and hence the name. The baby swallows blood during delivery or during breastfeeding if nipples are cracked. Apt test is based on the principle that if blood is of neonatal origin it will contain high proportion of hemoglobin F (Hb F) that is resistant to alkali denaturation. On the other hand, maternal blood mostly contains adult hemoglobin or Hb A that is less resistant.
Test for Malabsorption of Fat
Dietary fat is absorbed in the small intestine with the help of bile salts and pancreatic lipase. Fecal fat mainly consists of neutral fats (unsplit fats), fatty acids, and soaps (fatty acid salts). Normally very little fat is excreted in feces (<7 grams/day in adults). Excess excretion of fecal fat indicates malabsorption and is known as steatorrhea. It manifests as bulky, frothy, and foul-smelling stools, which float on the surface of water.
Causes of Malabsorption of Fat
- Deficiency of pancreatic lipase (insufficient lipolysis): chronic pancreatitis, cystic fibrosis.
- Deficiency of bile salts (insufficient emulsification of fat): biliary obstruction, severe liver disease, bile salt deconjugation due to bacterial overgrowth in the small intestine.
- Diseases of small intestine: tropical sprue, celiac disease, Whipple’s disease.
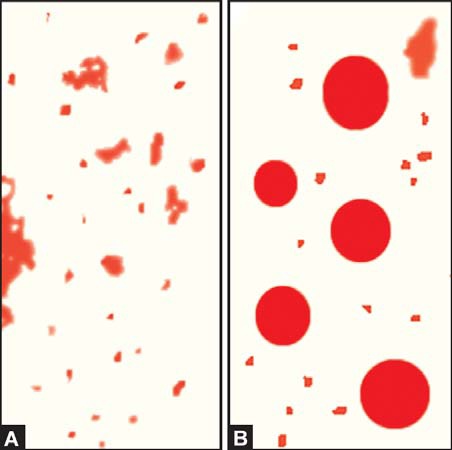
Tests for fecal fat are qualitative (i.e. direct microscopic examination after fat staining), and quantitative (i.e. estimation of fat by gravimetric or titrimetric analysis).
- Microscopic stool examination after staining for fat: A random specimen of stool is collected after putting the patient on a diet of >80 gm fat per day. Stool sample is stained with a fat stain (oil red O, Sudan III, or Sudan IV) and observed under the microscope for fat globules (Figure 845.2). Presence of ≥60 fat droplets/HPF indicates steatorrhea. Ingestion of mineral or castor oil and use of rectal suppositories can cause problems in interpretation.
- Quantitative estimation of fecal fat: The definitive test for diagnosis of fat malabsorption is quantitation of fecal fat. Patient should be on a diet of 70-100 gm of fat per day for 6 days before the test. Feces are collected over 72 hours and stored in a refrigerator during the collection period. Specimen should not be contaminated with urine. Fat quantitation can be done by gravimetric or titrimetric method. In gravimetric method, an accurately weighed sample of feces is emulsified, acidified, and fat is extracted in a solvent; after evaporation of solvent, fat is weighed as a pure compound. Titrimetric analysis is the most widely used method. An accurately weighed stool sample is treated with alcoholic potassium hydroxide to convert fat into soaps. Soaps are then converted to fatty acids by the addition of hydrochloric acid. Fatty acids are extracted in a solvent and the solvent is evaporated. The solution of fat made in neutral alcohol is then titrated against sodium hydroxide. Fatty acids comprise about 80% of fecal fat. Values >7 grams/day are usually abnormal. Values >14 grams/day are specific for diseases causing fat malabsorption.
Test for Urobilinogen in Feces
Fecal urobilinogen is determined by Ehrlich’s aldehyde test (see Article “Test for Detection of Urobilinogen in Urine”). Specimen should be fresh and kept protected from light. Normal amount of urobilinogen excreted in feces is 50-300 mg per day. Increased fecal excretion of urobilinogen is seen in hemolytic anemia. Urobilinogen is deceased in biliary tract obstruction, severe liver disease, oral antibiotic therapy (disturbance of intestinal bacterial flora), and aplastic anemia (low hemoglobin turnover). Stools become pale or clay-colored if urobilinogen is reduced or absent.
Test for Reducing Sugars
Deficiency of intestinal enzyme lactase is a common cause of malabsorption. Lactase converts lactose (in milk) to glucose and galactose. If lactase is deficient, lactose is converted to lactic acid with production of gas. In infants this leads to diarrhea, vomiting, and failure to thrive. Benedict’s test or Clinitest™ tablet test for reducing sugars is used to test freshly collected stool sample for lactose. In addition, oral lactose tolerance test is abnormal (after oral lactose, blood glucose fails to rise above 20 mg/dl of basal value) in lactase deficiency. Rise in blood glucose indicates that lactose has been hydrolysed and absorbed by the mucosa. Lactose tolerance test is now replaced by lactose breath hydrogen testing. In lactase deficiency, accumulated lactose in the colon is rapidly fermented to organic acids and gases like hydrogen. Hydrogen is absorbed and then excreted through the lungs into the breath. Amount of hydrogen is then measured in breath; breath hydrogen more than 20 ppm above baseline within 4 hours indicates positive test.
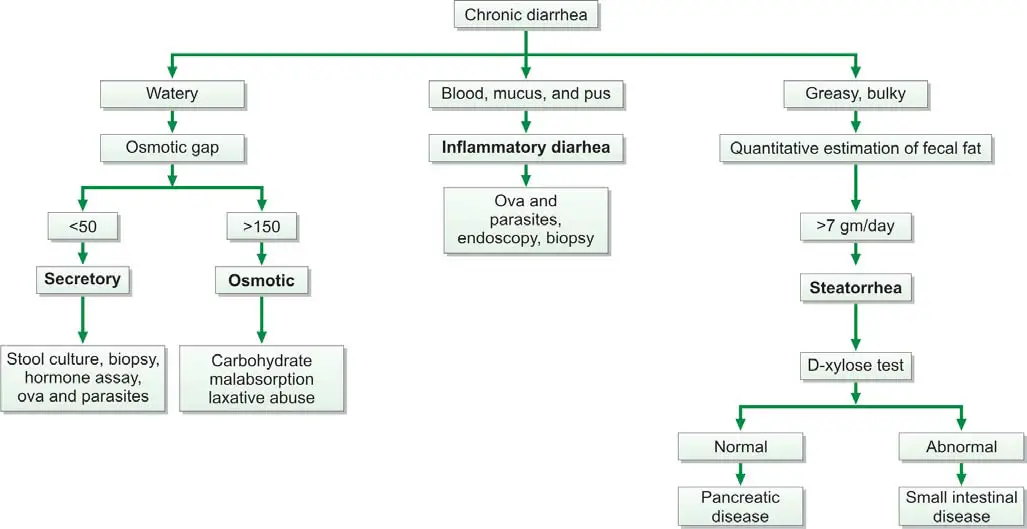
Fecal Osmotic Gap
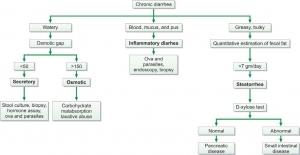
Fecal osmotic gap is calculated from concentration of electrolytes in stool water by formula 290-2([Na+] + [K+]). (290 is the assumed plasma osmolality). In osmotic diarrheas, osmotic gap is >150 mOsm/kg, while in secretory diarrhea, it is typically below 50 mOsm/kg. Evaluation of chronic diarrhea is shown in Figure 845.3.
Fecal pH
Stool pH below 5.6 is characteristic of carbohydrate malabsorption.
Laboratory Tests to Evaluate Tubular Function
These diagnostic assessments are designed to evaluate the performance of two crucial components of the kidney – the proximal and distal tubules. Proximal tubular function tests, such as Fractional Excretion of Sodium (FENa) and Tubular Reabsorption of Phosphate (TRP), gauge the efficiency of reabsorption in the proximal tubule. On the other hand, tests for distal tubular function, like the Urine Acidification Test, focus on the tubule's ability to maintain the body's acid-base balance. These tests play an important role in diagnosing renal disorders by providing valuable information on the specific functionalities of these intricate renal structures.
Tests to Assess Proximal Tubular Function
The renal tubules play a crucial role in reabsorbing 99% of the glomerular filtrate to retain vital substances such as glucose, amino acids, and water.
Glycosuria
Renal glycosuria manifests as the excretion of glucose in urine despite normal blood glucose levels. This occurrence results from a specific tubular lesion impairing glucose reabsorption, rendering renal glycosuria a benign condition. Notably, glycosuria may also manifest in Fanconi syndrome.
Generalized aminoaciduria
Proximal renal tubular dysfunction leads to the excretion of multiple amino acids in urine due to defective tubular reabsorption.
Tubular proteinuria (Low molecular weight proteinuria)
Under normal conditions, low molecular weight proteins, such as β2 –microglobulin, retinol-binding protein, lysozyme, and α1 –microglobulin, undergo filtration by glomeruli and complete reabsorption by proximal renal tubules. Tubular damage disrupts this process, causing the excretion of these proteins in urine, detectable by urine protein electrophoresis. Elevated levels of these proteins in urine indicate renal tubular damage.
Urinary concentration of sodium
When both blood urea nitrogen (BUN) and serum creatinine levels are acutely elevated, distinguishing between prerenal azotemia (renal underperfusion) and acute tubular necrosis becomes essential. In prerenal azotemia, renal tubules function normally, reabsorbing sodium, whereas in acute tubular necrosis, tubular function is impaired, resulting in decreased sodium absorption. Consequently, the urinary sodium concentration is < 20 mEq/L in prerenal azotemia and > 20 mEq/L in acute tubular necrosis.
Fractional excretion of sodium (FENa)
Given that urinary sodium concentration can be influenced by urine volume, calculating the fractional excretion of sodium provides a more accurate assessment. This metric represents the percentage of filtered sodium that has been absorbed and excreted. In cases of acute renal failure, especially in oliguric patients, FENa serves as a reliable means of early differentiation between pre-renal failure and renal failure due to acute tubular necrosis.
The formula for calculating FENa is as follows:
(Urine sodium × Plasma creatinine) ÷ (Plasma sodium × Urine creatinine) × 100%
In pre-renal failure, this ratio is less than 1%, reflecting maximal sodium conservation by tubules stimulated by aldosterone secretion due to reduced renal perfusion. In acute tubular necrosis, the ratio exceeds 1% since tubular cell injury hampers maximum sodium reabsorption. Ratios above 3% strongly suggest acute tubular necrosis.
Tests to Assess Distal Tubular Function
Urine specific gravity
The normal range for urine specific gravity is 1.003 to 1.030, contingent upon the individual's state of hydration and fluid intake.
- Causes of Increased Specific Gravity:
- Reduced renal perfusion (with preservation of tubular concentrating ability),
- Proteinuria,
- Glycosuria,
- Glomerulonephritis,
- Urinary tract obstruction.
- Causes of Reduced Specific Gravity:
- Diabetes insipidus,
- Chronic renal failure,
- Impaired concentrating ability due to tubular diseases.
As a test for renal function, urine specific gravity provides insights into the renal tubules' ability to concentrate the glomerular filtrate. This concentrating capability is compromised in diseases affecting the renal tubules.
A fixed specific gravity of 1.010, impervious to alteration with changes in fluid intake, serves as an indicator of chronic renal failure.
Urine osmolality
The measurement of urine/plasma osmolality stands as the most commonly employed test to assess tubular function. This method, highly sensitive to concentration ability, quantifies the number of dissolved particles in a solution. In contrast, specific gravity, measuring the total mass of solute in relation to water mass, is influenced by the number and nature of dissolved particles, making osmolality a preferred measurement. Osmolality is expressed as milliOsmol/kg of water.
When solutes are dissolved in a solvent, alterations occur in properties such as freezing point, boiling point, vapor pressure, or osmotic pressure. Osmolality measurement, conducted with an instrument known as an osmometer, captures these changes.
The urine/plasma osmolality ratio aids in distinguishing pre-renal azotemia (higher ratio) from acute renal failure due to acute tubular necrosis (lower ratio). Similar urine and plasma osmolality values indicate defective tubular reabsorption of water.
Water deprivation test
When baseline urine osmolality is inconclusive, the water deprivation test is performed. This test involves restricting water intake for a specified period, followed by the measurement of specific gravity or osmolality. In normal cases, urine osmolality should rise in response to water deprivation. Failure to increase prompts administration of desmopressin to differentiate between central and nephrogenic diabetes insipidus. A urine osmolality > 800 mOsm/kg or specific gravity ≥1.025 after dehydration indicates normal renal tubular concentration ability, although normal results do not exclude the presence of renal disease.
Results may be skewed if the patient is on a low-salt, low-protein diet or experiencing major electrolyte and water disturbances.
Water loading antidiuretic hormone suppression test
This test gauges the kidney's ability to dilute urine after water loading. After an overnight fast, the patient drinks 20 ml/kg of water in 15-30 minutes. Urine is collected hourly for 4 hours to measure volume, specific gravity, and osmolality. Plasma antidiuretic hormone levels and serum osmolality are measured at hourly intervals.
Normal results entail excreting over 90% of water in 4 hours, with specific gravity falling to 1.003 and osmolality to < 100 mOsm/kg. Impairments occur in renal function, adrenocortical insufficiency, malabsorption, obesity, ascites, congestive heart failure, cirrhosis, and dehydration. The test is contraindicated in patients with cardiac failure or kidney disease due to the risk of fatal hyponatremia in case of water load failure.
Ammonium chloride loading test (Acid load test)
Utilized in diagnosing distal or type 1 renal tubular acidosis, this test follows exclusion of other causes of metabolic acidosis. After overnight fasting, urine pH and plasma bicarbonate are measured. A pH less than 5.4 with low plasma bicarbonate confirms normal acidifying ability of renal tubules. In cases where neither of these results is obtained, further testing is warranted. The patient receives oral ammonium chloride (0.1 gm/kg) after an overnight fast, and urine samples collected hourly for 6-8 hours. Ammonium ion dissociation produces H+ and NH3, making blood acidic. A pH less than 5.4 in any sample confirms normal acidifying ability of distal tubules.
Microalbuminuria and Albuminuria
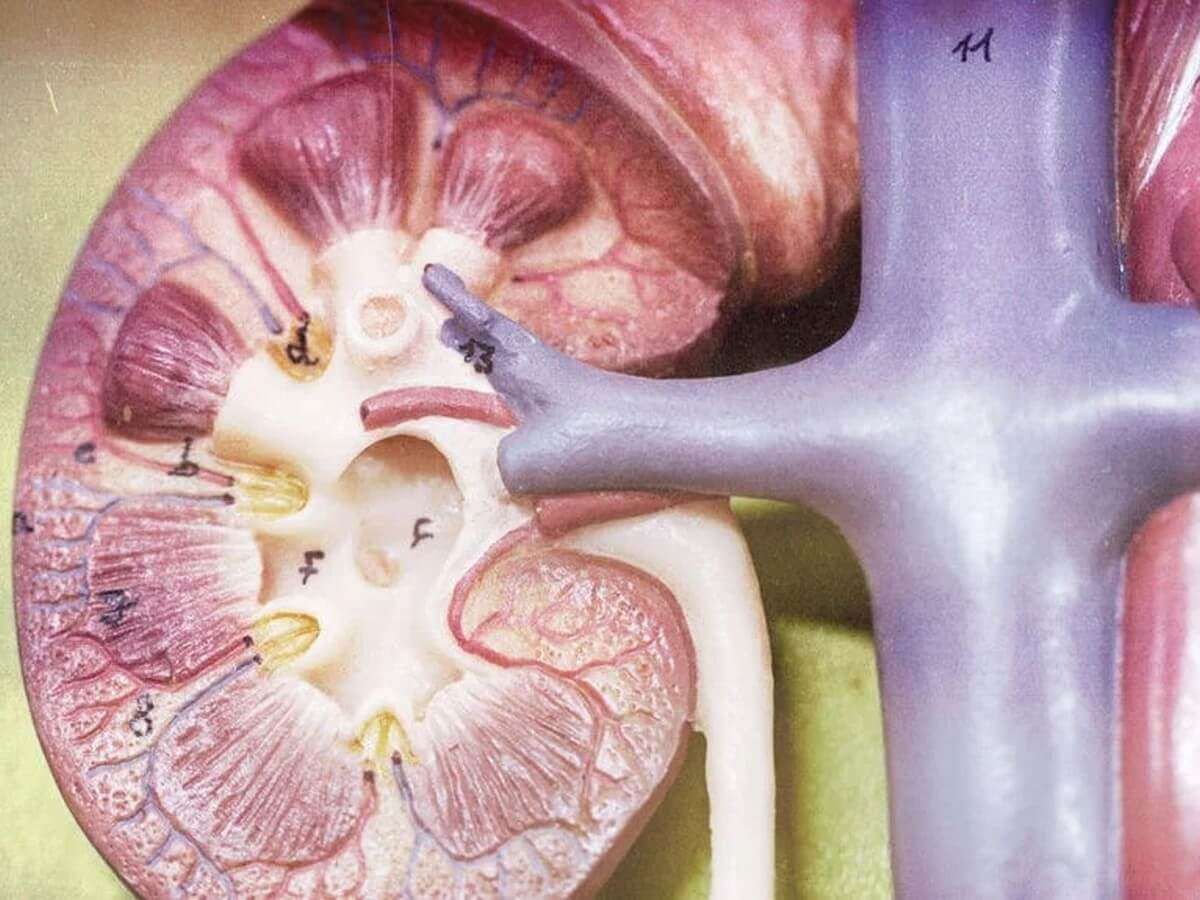
Normally, a very small amount of albumin is excreted in urine. The earliest evidence of glomerular damage in diabetes mellitus is occurrence of microalbuminuria (albuminuria in the range of 30 to 300 mg/24 hours). An albuminuria > 300-mg/24 hour is termed clinical or overt and indicates significant glomerular damage.
Microalbuminuria is a term used to describe the presence of small amounts of albumin in the urine. Albumin is a protein that is normally found in the blood, but when it appears in the urine, it can be an early sign of kidney damage. This condition is often associated with diabetes, as high blood sugar levels can damage the blood vessels in the kidneys, leading to the leakage of albumin into the urine. Additionally, microalbuminuria can also be an indicator of other underlying health issues, such as high blood pressure or cardiovascular disease.
On the other hand, albuminuria refers to the presence of larger amounts of albumin in the urine. It is often considered a more severe form of kidney damage compared to microalbuminuria. Albuminuria can be caused by a variety of factors, including diabetes, hypertension, glomerulonephritis, and certain medications. It is crucial to diagnose and monitor albuminuria as it can be a sign of progressive kidney disease and an increased risk of cardiovascular events.
Distinguishing between microalbuminuria and albuminuria is important as they have different diagnostic and clinical implications. Microalbuminuria is often considered an early warning sign of kidney damage, while albuminuria indicates more advanced kidney dysfunction. Identifying these conditions early on allows healthcare professionals to intervene and implement appropriate treatment strategies to prevent further kidney damage and manage associated health conditions.
It is also essential to differentiate albuminuria from proteinuria, another term used to describe the presence of excess protein in the urine. While albumin is a specific type of protein, proteinuria refers to the presence of any type of protein in the urine. Albuminuria is a subset of proteinuria, specifically referring to the presence of albumin. Understanding this distinction is crucial as albuminuria has specific diagnostic and prognostic implications, especially in the context of kidney disease and cardiovascular health.
To measure albuminuria levels, various techniques are available, including urine dipstick tests, spot urine albumin-to-creatinine ratio, and 24-hour urine collection. These methods allow healthcare professionals to quantify the amount of albumin in the urine and determine if it falls within the normal range or if further investigation is required. Abnormal levels of albuminuria can indicate kidney damage and the need for further evaluation and management.
Unraveling Microalbuminuria
Defining Microalbuminuria
Microalbuminuria refers to the presence of small amounts of albumin in the urine. Albumin is a protein that is normally found in the blood, but when it appears in the urine, it can be an early sign of kidney damage or dysfunction. The term "micro" in microalbuminuria signifies that the levels of albumin in the urine are relatively low, but still higher than what is considered normal.
The clinical importance of microalbuminuria lies in its association with various health conditions, particularly diabetes. In fact, microalbuminuria is often considered an early marker of kidney damage in individuals with diabetes. It serves as an indicator of the onset of diabetic nephropathy, a condition characterized by progressive kidney damage due to diabetes.
In addition to diabetes, microalbuminuria can also be seen in other conditions such as hypertension, cardiovascular disease, and certain kidney disorders. It is important to note that microalbuminuria may not always be accompanied by noticeable symptoms, making regular screening and monitoring crucial for early detection and intervention.
By identifying microalbuminuria early on, healthcare professionals can implement appropriate measures to prevent or slow down the progression of kidney damage. This may involve lifestyle modifications, such as maintaining optimal blood sugar and blood pressure levels, as well as medication management.
Furthermore, microalbuminuria can also serve as a prognostic indicator for cardiovascular disease. Studies have shown that individuals with microalbuminuria are at an increased risk of developing heart disease and experiencing cardiovascular events, such as heart attacks and strokes. Therefore, identifying and managing microalbuminuria can have broader implications for overall cardiovascular health.
What is Microalbuminuria?
Microalbuminuria is a term that is frequently used in the medical field, particularly in relation to kidney health. In this section, we will delve deeper into the precise definition of microalbuminuria and explore its clinical importance. By understanding what microalbuminuria is, we can better comprehend its implications and significance in various health conditions.
Microalbuminuria refers to the presence of small amounts of albumin in the urine. Albumin is a protein that is normally found in the blood, but when it appears in the urine, it can be an early sign of kidney damage or dysfunction. The term "micro" in microalbuminuria signifies that the levels of albumin in the urine are relatively low, but still higher than what is considered normal.
The clinical importance of microalbuminuria lies in its association with various health conditions, particularly diabetes. In fact, microalbuminuria is often considered an early marker of kidney damage in individuals with diabetes. It serves as an indicator of the onset of diabetic nephropathy, a condition characterized by progressive kidney damage due to diabetes.
In addition to diabetes, microalbuminuria can also be seen in other conditions such as hypertension, cardiovascular disease, and certain kidney disorders. It is important to note that microalbuminuria may not always be accompanied by noticeable symptoms, making regular screening and monitoring crucial for early detection and intervention.
By identifying microalbuminuria early on, healthcare professionals can implement appropriate measures to prevent or slow down the progression of kidney damage. This may involve lifestyle modifications, such as maintaining optimal blood sugar and blood pressure levels, as well as medication management.
Furthermore, microalbuminuria can also serve as a prognostic indicator for cardiovascular disease. Studies have shown that individuals with microalbuminuria are at an increased risk of developing heart disease and experiencing cardiovascular events, such as heart attacks and strokes. Therefore, identifying and managing microalbuminuria can have broader implications for overall cardiovascular health.
It is worth noting that microalbuminuria is different from proteinuria, which refers to the presence of larger amounts of protein in the urine. While both conditions indicate kidney damage, microalbuminuria specifically refers to the presence of albumin, whereas proteinuria encompasses a broader range of proteins.
Clinical Importance
Microalbuminuria is not just a random occurrence; it holds significant clinical importance in the field of medicine. By understanding the medical implications and relevance of microalbuminuria, healthcare professionals can better assess and manage various health conditions. In this section, we will delve deeper into the clinical importance of microalbuminuria and its implications for patient care.
One of the primary clinical implications of microalbuminuria is its association with kidney damage. As mentioned earlier, the presence of albumin in the urine can be an early sign of kidney dysfunction. In individuals with diabetes, microalbuminuria serves as an early marker of diabetic nephropathy, a condition characterized by progressive kidney damage due to diabetes. By detecting microalbuminuria, healthcare professionals can intervene early and implement measures to slow down the progression of kidney damage.
Moreover, microalbuminuria is not limited to diabetes alone. It can also be seen in individuals with hypertension, cardiovascular disease, and certain kidney disorders. Regular screening for microalbuminuria in these populations is crucial for early detection and intervention. By identifying microalbuminuria in individuals with these conditions, healthcare professionals can implement appropriate measures to prevent or manage kidney damage, ultimately improving patient outcomes.
In addition to its role in assessing kidney health, microalbuminuria also has broader implications for cardiovascular disease. Studies have shown that individuals with microalbuminuria are at an increased risk of developing heart disease and experiencing cardiovascular events, such as heart attacks and strokes. Therefore, identifying and managing microalbuminuria can have significant implications for overall cardiovascular health. By monitoring microalbuminuria levels and implementing appropriate interventions, healthcare professionals can help reduce the risk of cardiovascular complications in at-risk individuals.
Furthermore, microalbuminuria can serve as a prognostic indicator for overall health and well-being. Its presence can indicate underlying systemic inflammation and endothelial dysfunction, both of which are associated with various health conditions. By identifying microalbuminuria, healthcare professionals can further investigate the underlying causes and implement targeted interventions to address these systemic issues. This comprehensive approach to patient care can lead to improved overall health outcomes and a better quality of life for individuals with microalbuminuria.
Microalbuminuria in Diabetes
The Link with Diabetes
Investigating the connection between microalbuminuria and diabetes, it becomes evident that these two conditions are closely intertwined. Diabetes, a chronic metabolic disorder characterized by high blood sugar levels, can have significant implications on kidney health. In fact, microalbuminuria is often considered an early sign of diabetic kidney disease, also known as diabetic nephropathy.
Diabetic nephropathy is a progressive kidney disease that occurs as a result of long-standing diabetes. It is estimated that approximately 30-40% of individuals with diabetes will develop diabetic nephropathy, making it one of the leading causes of end-stage renal disease worldwide. Microalbuminuria serves as a crucial marker in identifying the onset and progression of this condition.
When diabetes is poorly controlled, high levels of glucose in the blood can damage the delicate blood vessels in the kidneys. These blood vessels, known as glomeruli, play a vital role in filtering waste products and excess fluid from the blood. The damage to the glomeruli leads to increased permeability, allowing small amounts of albumin, a protein normally found in the blood, to leak into the urine. This leakage of albumin is what characterizes microalbuminuria.
The presence of microalbuminuria in individuals with diabetes is a red flag, indicating that the kidneys are not functioning optimally. It serves as an early warning sign of potential kidney damage and the progression to more severe forms of kidney disease. Therefore, regular screening for microalbuminuria is recommended for individuals with diabetes to detect kidney dysfunction at an early stage.
Moreover, microalbuminuria is not only a marker of kidney damage but also a predictor of cardiovascular disease in individuals with diabetes. Studies have shown that the presence of microalbuminuria is associated with an increased risk of developing heart disease, stroke, and other cardiovascular complications. This highlights the importance of identifying and managing microalbuminuria in diabetic individuals to prevent the onset of these life-threatening conditions.
The link between microalbuminuria and diabetes is multifactorial. Apart from high blood glucose levels, other factors such as high blood pressure, smoking, and genetic predisposition can further contribute to the development and progression of microalbuminuria in individuals with diabetes. Therefore, it is crucial for healthcare professionals to address these risk factors comprehensively and provide appropriate management strategies to prevent or delay the progression of kidney disease.
Microalbuminuria serves as a crucial link between diabetes and kidney health. It acts as an early indicator of diabetic nephropathy and is associated with an increased risk of cardiovascular disease. Regular screening for microalbuminuria in individuals with diabetes is essential to detect kidney dysfunction at an early stage and implement appropriate interventions to prevent further complications. By understanding the link between microalbuminuria and diabetes, healthcare professionals can take proactive measures to protect the kidney and cardiovascular health of diabetic individuals.
Causes and Mechanisms
Understanding the underlying causes and mechanisms leading to microalbuminuria in diabetic individuals is crucial for effective management and prevention of kidney disease. Several factors contribute to the development of microalbuminuria in diabetes, including:
- Glomerular Damage: The primary cause of microalbuminuria in diabetes is damage to the glomeruli, the tiny blood vessels in the kidneys responsible for filtering waste products. High blood glucose levels, along with other factors such as high blood pressure and inflammation, can lead to the thickening and narrowing of the glomerular walls. This damages the filtration system, allowing albumin to leak into the urine.
- Increased Permeability: In diabetes, the glomerular filtration barrier becomes more permeable, allowing larger molecules like albumin to pass through. This increased permeability is due to the disruption of the podocytes, specialized cells that line the glomerular walls and help maintain the filtration barrier. The loss of podocyte function leads to the leakage of albumin into the urine.
- Oxidative Stress: Diabetes is associated with increased oxidative stress, which occurs when there is an imbalance between the production of harmful free radicals and the body's ability to neutralize them. Oxidative stress can damage the delicate structures of the kidneys, including the glomeruli, leading to microalbuminuria.
- Inflammation: Chronic inflammation plays a significant role in the development and progression of microalbuminuria in diabetes. Inflammatory processes can cause damage to the glomeruli and impair their function, resulting in the leakage of albumin into the urine.
- Endothelial Dysfunction: Diabetes affects the endothelial cells lining the blood vessels, including those in the glomeruli. Endothelial dysfunction leads to impaired regulation of blood flow and increased permeability of the glomerular filtration barrier, contributing to microalbuminuria.
- Renin-Angiotensin System (RAS) Activation: In diabetes, the renin-angiotensin system, which regulates blood pressure and fluid balance, becomes overactive. This activation leads to constriction of the blood vessels in the kidneys and increased production of angiotensin II, a hormone that promotes inflammation and fibrosis. These changes further contribute to glomerular damage and microalbuminuria.
- Genetic Predisposition: Some individuals may have a genetic predisposition to developing microalbuminuria in diabetes. Certain gene variants can affect the structure and function of the glomeruli, making them more susceptible to damage and albumin leakage.
Understanding these underlying causes and mechanisms is essential for targeted interventions to prevent or delay the progression of microalbuminuria in diabetic individuals. By addressing factors such as blood glucose control, blood pressure management, and inflammation reduction, healthcare professionals can help minimize glomerular damage and preserve kidney function.
In addition to lifestyle modifications, medications that target the renin-angiotensin system, such as angiotensin-converting enzyme inhibitors (ACE inhibitors) and angiotensin receptor blockers (ARBs), are commonly prescribed to individuals with microalbuminuria. These medications help reduce blood pressure, protect the glomeruli, and slow the progression of kidney disease.
Microalbuminuria in diabetes is caused by a combination of glomerular damage, increased permeability, oxidative stress, inflammation, endothelial dysfunction, RAS activation, and genetic predisposition. Understanding these causes and mechanisms is crucial for implementing effective strategies to prevent and manage microalbuminuria in diabetic individuals. By addressing these underlying factors, healthcare professionals can help preserve kidney function and reduce the risk of complications associated with microalbuminuria and diabetic kidney disease.
Deciphering Albuminuria
Defining Albuminuria
Albuminuria is a term that is often used in the medical field, particularly in relation to kidney health. In this section, we will delve deeper into the definition of albuminuria and explore its implications. By understanding what albuminuria is, we can gain valuable insights into its clinical significance and diagnostic value.
Albuminuria refers to the presence of albumin in the urine. Albumin is a protein that is normally found in the blood, but when it appears in the urine, it can be an indication of kidney damage or dysfunction. The kidneys play a crucial role in filtering waste products from the blood and maintaining the balance of fluids and electrolytes in the body. When the kidneys are functioning properly, they prevent the passage of albumin into the urine. However, when there is damage to the kidneys, the filtration process is compromised, leading to the leakage of albumin into the urine.
The presence of albumin in the urine can be an early sign of kidney disease or other underlying health conditions. It is important to note that albuminuria is not a disease itself, but rather a marker of kidney damage. By detecting albuminuria, healthcare professionals can identify individuals who may be at risk of developing kidney disease or who may already have kidney damage.
Distinguishing albuminuria from microalbuminuria is essential. While both terms refer to the presence of albumin in the urine, microalbuminuria specifically refers to a lower level of albumin in the urine. Microalbuminuria is often used as an early marker for kidney damage, particularly in individuals with diabetes. On the other hand, albuminuria generally indicates more significant kidney damage or dysfunction.
Understanding the medical terminology associated with albuminuria is crucial for accurate diagnosis and communication between healthcare professionals. By using standardized terminology, healthcare providers can ensure consistency in their assessments and interpretations of albuminuria. This allows for better collaboration and understanding among medical professionals, ultimately leading to improved patient care.
The diagnostic significance of albuminuria cannot be overstated. It serves as an important tool for identifying individuals at risk of kidney disease and monitoring the progression of existing kidney conditions. By measuring albuminuria levels, healthcare professionals can assess the severity of kidney damage and determine appropriate treatment plans. Additionally, albuminuria can also be an indicator of other health conditions, such as cardiovascular disease, hypertension, and diabetes.
Albuminuria is the presence of albumin in the urine and serves as a marker of kidney damage or dysfunction. It is important to differentiate between albuminuria and microalbuminuria, as they indicate different levels of albumin in the urine. Understanding the medical terminology associated with albuminuria is crucial for accurate diagnosis and effective communication among healthcare professionals. The diagnostic significance of albuminuria cannot be overlooked, as it provides valuable insights into kidney health and the presence of other underlying health conditions.
What is Albuminuria?
Albuminuria is a term that is frequently used in the medical field, particularly in relation to kidney health. It refers to the presence of albumin in the urine, which can be an indication of kidney damage or dysfunction. Albumin, a protein normally found in the blood, should not be present in the urine under normal circumstances. When albumin appears in the urine, it suggests that the kidneys are not functioning properly and are allowing the leakage of this protein.
Understanding what albuminuria is can provide valuable insights into its clinical significance and diagnostic value. While albuminuria itself is not a disease, it serves as a marker of kidney damage or dysfunction. By detecting albuminuria, healthcare professionals can identify individuals who may be at risk of developing kidney disease or who may already have kidney damage.
Distinguishing albuminuria from microalbuminuria is essential. Both terms refer to the presence of albumin in the urine, but microalbuminuria specifically refers to a lower level of albumin in the urine. Microalbuminuria is often used as an early marker for kidney damage, particularly in individuals with diabetes. On the other hand, albuminuria generally indicates more significant kidney damage or dysfunction.
The medical terminology associated with albuminuria is crucial for accurate diagnosis and effective communication among healthcare professionals. By using standardized terminology, healthcare providers can ensure consistency in their assessments and interpretations of albuminuria. This allows for better collaboration and understanding among medical professionals, ultimately leading to improved patient care.
The diagnostic significance of albuminuria cannot be overstated. It serves as an important tool for identifying individuals at risk of kidney disease and monitoring the progression of existing kidney conditions. By measuring albuminuria levels, healthcare professionals can assess the severity of kidney damage and determine appropriate treatment plans. Additionally, albuminuria can also be an indicator of other health conditions, such as cardiovascular disease, hypertension, and diabetes.
Albuminuria is the presence of albumin in the urine and serves as a marker of kidney damage or dysfunction. Distinguishing albuminuria from microalbuminuria is crucial, as they indicate different levels of albumin in the urine. Understanding the medical terminology associated with albuminuria is essential for accurate diagnosis and effective communication among healthcare professionals. The diagnostic significance of albuminuria cannot be overlooked, as it provides valuable insights into kidney health and the presence of other underlying health conditions. By detecting albuminuria, healthcare professionals can identify individuals at risk and take appropriate measures to prevent further kidney damage or manage existing conditions.
Distinguishing Albuminuria from Microalbuminuria
When it comes to understanding kidney health, it is important to differentiate between albuminuria and microalbuminuria. While both terms refer to the presence of albumin in the urine, there are key differences that set them apart. Let's explore these differences and understand why they are significant.
Albuminuria, as we discussed earlier, is the presence of albumin in the urine. It is an indication of kidney damage or dysfunction and suggests that the kidneys are not functioning properly. On the other hand, microalbuminuria specifically refers to a lower level of albumin in the urine. It is often used as an early marker for kidney damage, particularly in individuals with diabetes.
One of the main differences between albuminuria and microalbuminuria is the level of albumin present in the urine. Microalbuminuria is characterized by a relatively low level of albumin, usually between 30-300 mg per day. This lower level of albumin can be detected through specialized tests that are more sensitive to small amounts of albumin in the urine.
Albuminuria, on the other hand, generally indicates more significant kidney damage or dysfunction. The level of albumin in the urine is usually higher, exceeding 300 mg per day. This higher level of albumin suggests that the kidneys are experiencing more severe impairment and are unable to properly filter out the protein.
Another important distinction between albuminuria and microalbuminuria is their clinical significance. Microalbuminuria is often used as an early marker for kidney damage, particularly in individuals with diabetes. It can serve as a warning sign that the kidneys are not functioning optimally and that further damage may occur if appropriate measures are not taken.
Albuminuria, on the other hand, generally indicates more advanced kidney damage or dysfunction. It is associated with a higher risk of developing kidney disease and other complications. Detecting albuminuria is crucial for healthcare professionals to identify individuals who may require more intensive monitoring and treatment to prevent further kidney damage.
In terms of diagnostic value, both albuminuria and microalbuminuria play important roles. By measuring albuminuria levels, healthcare professionals can assess the severity of kidney damage and determine appropriate treatment plans. Microalbuminuria, in particular, can help identify individuals who may benefit from early interventions to prevent the progression of kidney disease.
It is worth noting that albuminuria can also be an indicator of other health conditions, such as cardiovascular disease, hypertension, and diabetes. Therefore, detecting albuminuria can provide valuable insights into a patient's overall health and help healthcare professionals identify and manage these underlying conditions.
Distinguishing between albuminuria and microalbuminuria is crucial for understanding kidney health and identifying individuals at risk of kidney disease. While both terms refer to the presence of albumin in the urine, microalbuminuria specifically indicates a lower level of albumin and serves as an early marker for kidney damage. Albuminuria, on the other hand, generally indicates more significant kidney damage or dysfunction. By detecting and monitoring albuminuria levels, healthcare professionals can assess the severity of kidney damage, identify underlying health conditions, and determine appropriate treatment plans.
Clinical Albuminuria
Medical Terminology
Examining albuminuria as a medical term and its application in clinical settings, it is important to understand the significance of this condition in diagnosing and managing various health conditions. Albuminuria refers to the presence of excessive amounts of albumin, a protein, in the urine. This condition is often an indicator of kidney damage or dysfunction.
Albuminuria is a term commonly used by healthcare professionals to describe the presence of albumin in the urine. It is an important diagnostic marker for kidney diseases, particularly those affecting the glomeruli, the tiny blood vessels in the kidneys responsible for filtering waste products from the blood. When the glomeruli are damaged, they may allow albumin to leak into the urine, leading to albuminuria.
The presence of albuminuria can be an early sign of kidney damage, even before other symptoms become apparent. It is often associated with conditions such as diabetes, hypertension, and chronic kidney disease. Monitoring albuminuria levels can help healthcare providers assess the progression of these conditions and make informed decisions regarding treatment and management.
In clinical settings, albuminuria is measured using various methods, including urine dipstick tests and laboratory analysis. These tests detect the presence of albumin in the urine and provide an indication of the severity of albuminuria. Normal levels of albumin in the urine are typically less than 30 milligrams per gram of creatinine (mg/g). Higher levels may indicate kidney damage or dysfunction.
The diagnostic significance of albuminuria lies in its ability to identify individuals at risk of developing kidney disease or those who already have kidney damage. It serves as a valuable tool for healthcare providers to assess kidney function and determine the appropriate course of action. By monitoring albuminuria levels over time, healthcare professionals can track the progression of kidney disease and make necessary adjustments to treatment plans.
Furthermore, albuminuria can also be used to assess the effectiveness of interventions aimed at reducing kidney damage. For example, in individuals with diabetes, tight control of blood glucose levels and blood pressure can help prevent or delay the onset of kidney disease. Regular monitoring of albuminuria levels can provide valuable feedback on the success of these interventions and guide further treatment decisions.
Diagnostic Significance
Albuminuria plays a crucial role in medical assessments as it holds significant diagnostic value. By detecting the presence of excessive amounts of albumin in the urine, healthcare professionals can gain valuable insights into the underlying health conditions and make informed decisions regarding treatment and management. This section will delve into the diagnostic significance of albuminuria and its implications in clinical practice.
One of the primary uses of albuminuria as a diagnostic marker is in identifying individuals at risk of developing kidney disease or those who already have kidney damage. As mentioned earlier, albuminuria is often associated with conditions such as diabetes, hypertension, and chronic kidney disease. Monitoring albuminuria levels can help healthcare providers assess the progression of these conditions and determine the appropriate course of action. By identifying albuminuria early on, interventions can be implemented to prevent or delay the onset of kidney disease, leading to improved patient outcomes.
In addition to kidney disease, albuminuria can also serve as an indicator of other systemic conditions. For example, it has been found that albuminuria is associated with cardiovascular disease. Studies have shown that individuals with albuminuria are at a higher risk of developing heart disease, stroke, and other cardiovascular events. Therefore, by monitoring albuminuria levels, healthcare professionals can identify individuals who may benefit from further cardiovascular assessments and interventions.
Furthermore, albuminuria can provide valuable information about the effectiveness of interventions aimed at reducing kidney damage and improving overall health. For instance, in individuals with diabetes, tight control of blood glucose levels and blood pressure can help prevent or delay the onset of kidney disease. Regular monitoring of albuminuria levels can serve as a feedback mechanism to assess the success of these interventions. If albuminuria levels decrease over time, it indicates that the interventions are effective in preserving kidney function and reducing the risk of complications.
Another diagnostic significance of albuminuria lies in its ability to differentiate between different types of kidney diseases. While albuminuria is primarily associated with glomerular damage, proteinuria, which refers to the presence of excessive amounts of protein in the urine, can be indicative of tubular damage. By distinguishing between albuminuria and proteinuria, healthcare professionals can narrow down the potential causes of kidney dysfunction and tailor treatment plans accordingly.
Albuminuria holds significant diagnostic significance in medical assessments. By monitoring albuminuria levels, healthcare professionals can identify individuals at risk of developing kidney disease, assess the progression of existing conditions, and make informed decisions regarding treatment and management. Additionally, albuminuria can serve as an indicator of other systemic conditions, such as cardiovascular disease. Furthermore, albuminuria can provide valuable information about the effectiveness of interventions aimed at reducing kidney damage. By understanding the diagnostic significance of albuminuria, healthcare professionals can utilize this information to improve patient outcomes and tailor treatment plans for optimal results.
Comparative Analysis
Albuminuria vs Proteinuria
Differentiating Albuminuria and Proteinuria
Albuminuria and proteinuria are two terms often used interchangeably, but they actually refer to different conditions. In this section, we will delve into the distinctions between albuminuria and proteinuria, shedding light on their differences and clinical implications.
Albuminuria, as we discussed earlier, is the presence of albumin in the urine. It is a specific type of proteinuria, where the protein being excreted is primarily albumin. On the other hand, proteinuria refers to the presence of any type of protein in the urine, not just albumin. While albumin is the most common protein found in urine, proteinuria can also include other proteins such as globulins and enzymes.
One key difference between albuminuria and proteinuria lies in their diagnostic significance. Albuminuria is often considered an early sign of kidney damage, particularly in the context of diabetes. It is a sensitive marker for detecting early kidney dysfunction and can be an indicator of increased cardiovascular risk. On the other hand, proteinuria, especially when it involves other proteins besides albumin, may indicate more severe kidney damage or underlying systemic conditions.
Another important distinction is the measurement techniques used to assess albuminuria and proteinuria levels. Albuminuria is typically measured using a urine albumin-to-creatinine ratio (ACR) or a spot urine albumin test. These tests provide a quantitative assessment of the amount of albumin present in the urine. Proteinuria, on the other hand, is often measured using a 24-hour urine collection or a spot urine protein test. These tests provide a broader assessment of all types of proteins present in the urine.
Clinical implications also differ between albuminuria and proteinuria. Albuminuria, particularly in the context of diabetes, is associated with an increased risk of developing kidney disease and cardiovascular complications. It is an important marker for monitoring the progression of kidney disease and guiding treatment decisions. Proteinuria, especially when it involves other proteins besides albumin, may indicate more severe kidney damage and can be a sign of underlying systemic conditions such as autoimmune diseases or infections.
In summary, while albuminuria and proteinuria are related terms, they have distinct differences. Albuminuria specifically refers to the presence of albumin in the urine and is often considered an early sign of kidney damage, particularly in diabetes. Proteinuria, on the other hand, encompasses the presence of any type of protein in the urine and may indicate more severe kidney damage or underlying systemic conditions. The measurement techniques, diagnostic significance, and clinical implications of albuminuria and proteinuria also vary. Understanding these differences is crucial for accurate diagnosis and appropriate management of kidney-related conditions.
Clinical Implications
Understanding the clinical significance of distinguishing between albuminuria and proteinuria is crucial for accurate diagnosis and appropriate management of kidney-related conditions. While these terms are often used interchangeably, they have distinct differences that impact their diagnostic value and treatment implications.
Albuminuria, as we discussed earlier, refers specifically to the presence of albumin in the urine. It is a sensitive marker for detecting early kidney dysfunction, particularly in the context of diabetes. The measurement of albuminuria levels, usually done through a urine albumin-to-creatinine ratio (ACR) or a spot urine albumin test, provides a quantitative assessment of the amount of albumin excreted in the urine. This information is valuable in monitoring the progression of kidney disease and guiding treatment decisions.
The clinical implications of albuminuria extend beyond kidney health. Research has shown that albuminuria is associated with an increased risk of developing cardiovascular complications. It serves as an important marker for identifying individuals at higher risk of heart disease and stroke. By detecting albuminuria early on, healthcare providers can implement interventions to reduce cardiovascular risk factors and improve patient outcomes.
On the other hand, proteinuria encompasses the presence of any type of protein in the urine, not just albumin. While albumin is the most common protein found in urine, proteinuria can also include other proteins such as globulins and enzymes. The measurement of proteinuria levels, often done through a 24-hour urine collection or a spot urine protein test, provides a broader assessment of all types of proteins present in the urine.
The presence of proteinuria, especially when it involves proteins other than albumin, may indicate more severe kidney damage or underlying systemic conditions. It can be a sign of advanced kidney disease or other health issues such as autoimmune diseases or infections. Identifying proteinuria and determining its underlying cause is essential for appropriate management and treatment planning.
Differentiating between albuminuria and proteinuria is not only important for diagnostic purposes but also for monitoring treatment response. For example, in individuals with diabetes, reducing albuminuria levels is a key treatment goal. By closely monitoring albuminuria levels over time, healthcare providers can assess the effectiveness of interventions such as blood pressure control, glucose management, and medication adjustments.
Moreover, the distinction between albuminuria and proteinuria has implications for research and clinical trials. Studies focusing on albuminuria as an endpoint can provide valuable insights into the efficacy of interventions in preventing or slowing the progression of kidney disease. By specifically targeting albuminuria reduction, researchers can evaluate the impact of interventions on kidney health and cardiovascular outcomes.
Quantifying Albuminuria Levels
Measurement Techniques
Methods for Assessing Albuminuria Levels
Assessing albuminuria levels is crucial in diagnosing and monitoring kidney function. Various techniques are employed to accurately measure albuminuria, providing valuable insights into the health of the kidneys. In this section, we will delve into the different methods used to assess albuminuria levels and their significance in clinical practice.
One commonly used method for assessing albuminuria levels is the urine albumin-to-creatinine ratio (UACR). This test measures the amount of albumin in the urine relative to the amount of creatinine, a waste product produced by the muscles. The UACR is a simple and convenient test that can be performed on a random urine sample. It is widely used in clinical settings due to its accuracy and reliability in detecting albuminuria.
Another method used to assess albuminuria levels is the 24-hour urine collection. This method involves collecting all urine produced over a 24-hour period and measuring the amount of albumin present. The 24-hour urine collection provides a more accurate assessment of albuminuria levels as it takes into account the variations in urine production throughout the day. However, this method can be cumbersome for patients and may lead to incomplete or inaccurate collections.
In addition to these methods, there are also semi-quantitative tests available for assessing albuminuria levels. These tests, such as the dipstick test, provide a qualitative assessment of albuminuria by detecting the presence or absence of albumin in the urine. While these tests are less precise than quantitative methods, they can still be useful in screening for albuminuria in certain situations.
It is important to note that albuminuria levels can vary throughout the day and may be influenced by factors such as physical activity, diet, and medication. Therefore, it is recommended to perform multiple measurements over time to obtain a more accurate assessment of albuminuria levels. This longitudinal approach helps to account for any fluctuations and provides a clearer picture of kidney function.
The interpretation of albuminuria levels depends on the specific method used for assessment. Generally, albuminuria levels are classified into three categories: normal, microalbuminuria, and macroalbuminuria. Normal levels indicate that the kidneys are functioning properly, while microalbuminuria and macroalbuminuria indicate varying degrees of kidney damage. Microalbuminuria refers to a slightly elevated level of albumin in the urine, which can be an early sign of kidney dysfunction. Macroalbuminuria, on the other hand, indicates a significant increase in albumin levels and is often associated with more advanced kidney disease.
Assessing albuminuria levels is essential for evaluating kidney function. The urine albumin-to-creatinine ratio, 24-hour urine collection, and semi-quantitative tests are commonly used methods for measuring albuminuria. Each method has its advantages and limitations, and multiple measurements over time are recommended for a more accurate assessment. Understanding albuminuria levels helps healthcare professionals diagnose and monitor kidney disease, enabling timely intervention and management.
Normal vs Abnormal Levels
When assessing albuminuria levels, it is important to establish the parameters that determine whether the levels are within the normal range or indicate abnormal kidney function. By understanding these parameters, healthcare professionals can accurately diagnose and monitor kidney disease. In this section, we will explore the criteria used to classify albuminuria levels as normal or abnormal.
The classification of albuminuria levels is primarily based on the amount of albumin present in the urine. Normal levels of albumin in the urine indicate that the kidneys are functioning properly and there is no evidence of kidney damage. On the other hand, abnormal levels of albumin in the urine suggest varying degrees of kidney dysfunction.
Microalbuminuria is a term used to describe slightly elevated levels of albumin in the urine. It is considered an early sign of kidney dysfunction and can be an indicator of early-stage kidney disease. The threshold for diagnosing microalbuminuria varies depending on the method used for assessment. The urine albumin-to-creatinine ratio (UACR) is commonly used to determine microalbuminuria levels. Generally, a UACR between 30-300 mg/g is considered indicative of microalbuminuria. However, it is important to note that different guidelines may have slightly different thresholds for diagnosis.
Macroalbuminuria, also known as overt albuminuria, refers to a significant increase in albumin levels in the urine. It is often associated with more advanced kidney disease and indicates a higher degree of kidney damage. The threshold for diagnosing macroalbuminuria is typically a UACR greater than 300 mg/g. At this level, the kidneys are not effectively filtering waste products, including albumin, leading to its accumulation in the urine.
It is worth mentioning that the classification of albuminuria levels is not solely based on the UACR. Other factors, such as the presence of other symptoms, medical history, and the results of additional tests, are also taken into consideration when determining the severity of kidney disease. These factors help healthcare professionals make a comprehensive assessment and develop an appropriate treatment plan.
In addition to the UACR, the 24-hour urine collection method is another way to assess albuminuria levels. Normal levels of albumin in a 24-hour urine collection are typically less than 30 mg. Levels between 30-300 mg are considered indicative of microalbuminuria, while levels greater than 300 mg suggest macroalbuminuria.
It is important to note that albuminuria levels can fluctuate throughout the day and may be influenced by various factors such as physical activity, diet, and medication. Therefore, it is recommended to perform multiple measurements over time to obtain a more accurate assessment of albuminuria levels. This longitudinal approach helps to account for any variations and provides a clearer picture of kidney function.
The classification of albuminuria levels as normal or abnormal is based on the amount of albumin present in the urine. Microalbuminuria refers to slightly elevated levels of albumin and is considered an early sign of kidney dysfunction. Macroalbuminuria indicates a significant increase in albumin levels and is associated with more advanced kidney disease. The UACR and 24-hour urine collection are commonly used methods to assess albuminuria levels. Multiple measurements over time are recommended to obtain a more accurate assessment. Understanding the classification of albuminuria levels helps healthcare professionals diagnose and monitor kidney disease, enabling timely intervention and management.
Summary
Throughout this article, we have explored the concepts of microalbuminuria and albuminuria, delving into their definitions, clinical significance, and diagnostic criteria. By understanding these terms and their implications, healthcare professionals can effectively diagnose and monitor kidney disease, enabling timely intervention and management.
Microalbuminuria is characterized by slightly elevated levels of albumin in the urine. It serves as an early sign of kidney dysfunction and can be an indicator of early-stage kidney disease. The urine albumin-to-creatinine ratio (UACR) is commonly used to determine microalbuminuria levels, with a UACR between 30-300 mg/g considered indicative of this condition. However, it is important to note that different guidelines may have slightly different thresholds for diagnosis.
On the other hand, macroalbuminuria, also known as overt albuminuria, refers to a significant increase in albumin levels in the urine. It is often associated with more advanced kidney disease and indicates a higher degree of kidney damage. A UACR greater than 300 mg/g is typically used to diagnose macroalbuminuria. At this level, the kidneys are not effectively filtering waste products, including albumin, leading to its accumulation in the urine.
It is worth mentioning that the classification of albuminuria levels is not solely based on the UACR. Other factors, such as the presence of other symptoms, medical history, and the results of additional tests, are also taken into consideration when determining the severity of kidney disease. This comprehensive assessment helps healthcare professionals develop an appropriate treatment plan tailored to the individual patient.
In addition to the UACR, the 24-hour urine collection method is another way to assess albuminuria levels. Normal levels of albumin in a 24-hour urine collection are typically less than 30 mg. Levels between 30-300 mg are considered indicative of microalbuminuria, while levels greater than 300 mg suggest macroalbuminuria. However, it is important to note that albuminuria levels can fluctuate throughout the day and may be influenced by various factors such as physical activity, diet, and medication. Therefore, performing multiple measurements over time is recommended to obtain a more accurate assessment of albuminuria levels.
In conclusion, microalbuminuria and albuminuria are important indicators of kidney function and can provide valuable insights into the presence and progression of kidney disease. Microalbuminuria serves as an early warning sign, while macroalbuminuria indicates more advanced kidney damage. The UACR and 24-hour urine collection are commonly used methods to assess albuminuria levels, but a comprehensive evaluation that considers other factors is necessary for an accurate diagnosis. By understanding the classification of albuminuria levels and utilizing appropriate diagnostic tools, healthcare professionals can effectively manage and treat kidney disease, improving patient outcomes and quality of life.
Biochemical Tests Used to Assess Renal Function

Renal function is often evaluated using two primary biochemical parameters: blood urea nitrogen (BUN) and serum creatinine. Despite their convenience, these markers prove to be less sensitive indicators of glomerular function.
Blood Urea Nitrogen (BUN)
Urea originates in the liver through the conversion of amino acids, whether derived from ingested sources or tissues. Amino acids play a crucial role in energy production, protein synthesis, and are subject to catabolism, leading to the formation of ammonia. The liver, in the Krebs urea cycle, transforms this ammonia into urea. Given the toxicity of ammonia, its conversion to urea ensures safe elimination through urine excretion (refer to Figure 1).
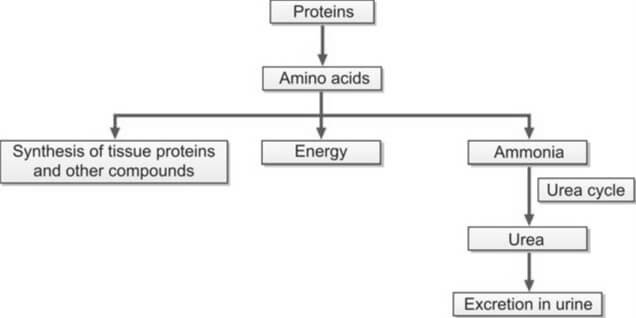
The concentration of blood urea is commonly expressed as blood urea nitrogen (BUN), a practice rooted in older methods that exclusively assessed the nitrogen content in urea. With urea's molecular weight being 60, a gram mole of urea contains 28 grams of nitrogen. This relationship, expressed as 60/28, allows the conversion of BUN to urea by multiplying BUN by 2.14, thereby establishing the real concentration of urea as BUN × (60/28).
Glomeruli completely filter urea, and depending on an individual's hydration status, approximately 30-40% of the filtered amount is reabsorbed in the renal tubules.
The blood level of urea is susceptible to various non-renal factors, such as a high-protein diet, upper gastrointestinal hemorrhage, and liver function. Consequently, the utility of BUN as a reliable indicator of renal function is limited. Significant destruction of renal parenchyma is necessary before an elevation in blood urea can be observed.
Azotemia refers to an increase in the blood level of urea, while uremia represents the clinical syndrome resulting from this elevation. In the absence of renal function, BUN experiences a daily rise of 10-20 mg/dl.
Causes of increased BUN
- Pre-renal Azotemia: Conditions such as shock, congestive heart failure, and salt and water depletion
- Renal Azotemia: Impairment of renal function
- Post-renal Azotemia: Obstruction of the urinary tract
- Increased Rate of Urea Production:
- Adoption of a high-protein diet
- Elevated protein catabolism due to factors such as trauma, burns, or fever
- Absorption of amino acids and peptides resulting from significant gastrointestinal hemorrhage or tissue hematoma
Methods for estimation of BUN
Two methods are commonly used.
- Diacetyl Monoxime Urea Method: A direct approach involving the reaction of urea with diacetyl monoxime at high temperatures, facilitated by a strong acid and an oxidizing agent. This reaction yields a yellow diazine derivative, and the color intensity is quantified using a colorimeter or spectrophotometer.
- Urease-Berthelot Reaction: An indirect method where the enzyme urease catalyzes the separation of ammonia from the urea molecule at 37°C. The resulting ammonia is then reacted with alkaline hypochlorite and phenol in the presence of a catalyst, producing a stable color known as indophenol. The intensity of the color produced is subsequently measured at 570 nm using a spectrophotometer.
The established reference range for Blood Urea Nitrogen (BUN) in adults spans from 7 to 18 mg/dl. However, for individuals aged over 60 years, the acceptable range extends slightly, ranging from 8 to 21 mg/dl.
Serum Creatinine
Creatinine, a nitrogenous waste product, originates in muscle through the conversion of creatine phosphate. Its endogenous production correlates with muscle mass and body weight, with exogenous creatinine from meat ingestion exerting minimal influence on daily creatinine excretion.
When compared to Blood Urea Nitrogen (BUN), serum creatinine emerges as a more specific and sensitive indicator of renal function for several reasons:
- Creatinine is consistently produced by muscles at a steady rate, remaining unaffected by dietary variations, protein catabolism, or other external factors.
- Unlike BUN, creatinine is not reabsorbed, and only a minimal amount is secreted by the renal tubules.
While an increased creatinine level reflects a reduction in glomerular filtration rate when muscle mass is constant, the manifestation of elevated serum creatinine levels (e.g., from 1.0 mg/dl to 2.0 mg/dl) in blood is delayed until about 50% of kidney function is lost, owing to significant kidney reserve. Consequently, serum creatinine proves less sensitive in detecting early renal impairment. It's important to note that a laboratory report indicating serum creatinine within the normal range does not necessarily denote normalcy; the level should be correlated with the individual's body weight, age, and sex. In the absence of renal function, serum creatinine rises by 1.0 to 1.5 mg/dl per day (refer to Figure 2).
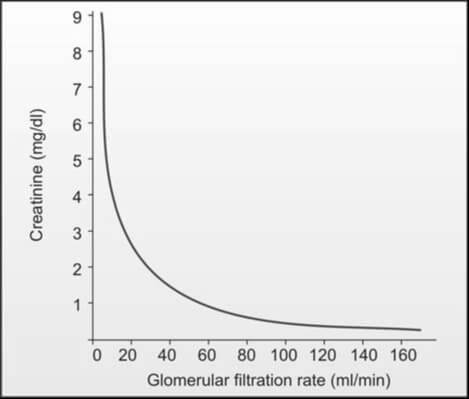
Causes of Increased Serum Creatinine Level
- Pre-renal, renal, and post-renal azotemia
- High intake of dietary meat
- Presence of active acromegaly and gigantism
Causes of Decreased Serum Creatinine Level
- Pregnancy
- Increasing age (reduction in muscle mass)
Methods for Estimation of Serum Creatinine
The assay for serum creatinine stands out for its cost-effectiveness, widespread availability, and simplicity in execution. Two commonly employed methods are as follows:
- Jaffe’s Reaction (Alkaline Picrate Reaction): This method holds prominence as the most widely used. In an alkaline solution, creatinine reacts with picrate, yielding a spectrophotometric response at 485 nm. Notably, certain plasma components like glucose, protein, fructose, ascorbic acid, acetoacetate, acetone, and cephalosporins exhibit a similar reaction with picrate, collectively termed non-creatinine chromogens. Their interaction can lead to a false elevation of serum creatinine levels, resulting in a 'true' creatinine value that is understated by 0.2 to 0.4 mg/dl when assessed through Jaffe’s reaction.
- Enzymatic Methods: This alternative approach employs enzymes that catalyze the cleavage of creatinine. Subsequent to the production of hydrogen peroxide, its reaction with phenol and a dye generates a colored product, measurable through spectrophotometry.
Reference Range
- Adult males: 0.7-1.3 mg/dl
- Adult females: 0.6-1.1 mg/dl
Relying solely on serum creatinine for the evaluation of renal function is not recommended. The concentration of serum creatinine is influenced by factors such as age, sex, muscle mass, glomerular filtration, and the extent of tubular secretion. Consequently, the normal range for serum creatinine is broad. The elevation of serum creatinine becomes apparent when the glomerular filtration rate (GFR) falls below 50% of the normal level. Even a minor increase in serum creatinine is indicative of a significant reduction in GFR, as illustrated in Figure 2. Consequently, the early stages of chronic renal impairment cannot be effectively identified through the measurement of serum creatinine alone.
BUN/Serum Creatinine Ratio
Clinicians commonly calculate BUN/creatinine ratio as a diagnostic tool to differentiate pre-renal and post-renal azotemia from renal azotemia. The standard range for this ratio is 12:1 to 20:1.
Causes of Increased BUN/Creatinine Ratio (>20:1):
- Elevated BUN with normal serum creatinine:
- Pre-renal azotemia (resulting from reduced renal perfusion)
- High protein diet
- Increased protein catabolism
- Gastrointestinal hemorrhage
- Elevation of both BUN and serum creatinine with a disproportionately greater increase in BUN:
- Post-renal azotemia (caused by obstruction to urine outflow)
- Obstruction to urinary outflow induces the diffusion of urinary urea back into the bloodstream from tubules due to increased backpressure.
Causes of Decreased BUN/Creatinine Ratio (<10:1)
- Acute tubular necrosis
- Low protein diet and starvation
- Severe liver disease
Clearance Tests to Measure Glomerular Filtration Rate (GFR)

Glomerular filtration rate (GFR) represents the rate in ml/min at which a substance is effectively cleared from the bloodstream by the glomeruli. The evaluative measure of the glomeruli's ability to filter a substance from the blood is conducted through clearance studies. If a substance is unbound to plasma proteins, undergoes complete filtration by the glomeruli, and experiences neither tubular secretion nor reabsorption, its clearance rate aligns with the glomerular filtration rate.
The clearance of a substance denotes the volume of plasma entirely purged of that substance per minute, calculated using the formula:
Clearance = UV⁄P
Here, U signifies the concentration of the substance in urine in mg/dl; V denotes the volume of excreted urine in ml/min; and P represents the concentration of the substance in plasma in mg/dl. Given that U and P share the same units, they mutually nullify, rendering the clearance value expressed in the same unit as V, i.e., ml/min. All clearance values are standardized to a standard body surface area of 1.73 m2.
The substances employed for gauging glomerular filtration rate (GFR) encompass:
- Exogenous: Inulin, Radiolabelled ethylenediamine tetraacetic acid (51Cr- EDTA), 125I-iothalamate
- Endogenous: Creatinine, Urea, Cystatin C
The selected agent for GFR measurement should exhibit the following properties: (1) Physiological inertness, preferably endogenous nature, (2) Unrestricted filtration by glomeruli without reabsorption or secretion by renal tubules, (3) No binding to plasma proteins and resistance to renal metabolism, and (4) Sole excretion by the kidneys. However, an entirely ideal endogenous agent remains elusive.
Conducting clearance tests proves to be intricate, costly, and not readily accessible. A significant challenge in clearance studies lies in the potential for incomplete urine collection.
Anomalous clearance patterns manifest in: (i) pre-renal factors such as diminished blood flow due to shock, dehydration, and congestive cardiac failure; (ii) renal diseases; and (iii) obstruction in urinary outflow.
Inulin Clearance
Inulin, an inert plant polysaccharide (a fructose polymer), undergoes glomerular filtration without reabsorption or secretion by the renal tubules, rendering it an ideal agent for GFR measurement. The procedure involves administering a bolus dose of inulin (25 ml of 10% solution IV), followed by a constant intravenous infusion (500 ml of 1.5% solution at a rate of 4 ml/min). Timed urine samples are collected, and blood samples are obtained at the midpoint of the timed urine collection. Widely recognized as the 'gold standard' or reference method for GFR estimation, this test is seldom employed due to its time-consuming nature, high cost, the requirement for continuous intravenous inulin infusion to maintain a steady plasma level, and challenges in laboratory analysis. The average inulin clearance is 125 ml/min/1.73 m2 for males and 110 ml/min/1.73 m2 for females. Clearance tends to be lower in children under 2 years and older adults. Primarily reserved for clinical research, this test is not commonly utilized in routine clinical practice.
Clearance of Radiolabeled Agents
Urinary clearance of radiolabeled iothalamate (125Iiothalamate) exhibits a close correlation with inulin clearance. Nevertheless, this technique is associated with high costs and potential exposure to radioactive substances. Alternative radiolabeled substances employed for similar purposes include 51Cr-EDTA and 99Tc-DTPA.
Cystatin C Clearance
Cystatin C, a cysteine protease inhibitor with a molecular weight of 13,000, is consistently synthesized by all nucleated cells at a constant rate. Unbound to proteins, it undergoes free filtration by glomeruli and is not reabsorbed into circulation post-filtration. Demonstrating greater sensitivity and specificity for impaired renal function than plasma creatinine, cystatin C serves as a marker unaffected by factors like sex, diet, or muscle mass. Many consider cystatin C superior to creatinine clearance as an estimator of GFR. Its measurement is typically conducted through immunoassay techniques.
Creatinine Clearance
The most widely employed method for assessing GFR is through creatinine clearance testing.
Creatinine, a continuous byproduct of muscle creatine, undergoes complete filtration by glomeruli and experiences negligible reabsorption by tubules, with a minor portion being tubularly secreted.
A 24-hour urine sample is the preferred collection method, mitigating issues related to diurnal variations in creatinine excretion and enhancing collection accuracy.
The procedure involves discarding the initial morning void and subsequently collecting all subsequent urine in the provided container. The next morning, the first voided urine is also collected, and the container is submitted to the laboratory. Simultaneously, a blood sample is drawn at the midpoint of the urine collection period to estimate plasma creatinine levels. Creatinine clearance is calculated using the following parameters: (1) creatinine concentration in urine in mg/ml (U), (2) volume of urine excreted in ml/min (V) – calculated as the volume of urine collected per the collection time in minutes (e.g., volume of urine collected in 24 hours ÷ 1440), and (3) creatinine concentration in plasma in mg/dl (P). The resulting creatinine clearance in ml/min per 1.73 m2 is derived from the formula UV/P.
Due to tubular secretion of creatinine, this formula tends to overestimate GFR by approximately 10%. In cases of advanced renal failure, where tubular secretion of creatinine is heightened, the overestimation of GFR becomes even more pronounced.
Jaffe's reaction, utilized for estimating creatinine (refer to serum creatinine), measures creatinine as well as other substances (non-creatinine chromogens) in the blood, resulting in a slightly elevated outcome. Consequently, the impact of tubular secretion of creatinine is somewhat counteracted by the minor overestimation of serum creatinine facilitated by Jaffe's reaction.
To yield values closer to the actual GFR, cimetidine, a substance that impedes secretion by renal tubules, can be administered before initiating urine collection, a method known as cimetidine-enhanced creatinine clearance.
Creatinine clearance, while widely used, possesses certain limitations for GFR estimation due to the following factors:
- A small amount of creatinine is secreted by renal tubules, a phenomenon accentuated in advanced renal failure.
- Urine collection is frequently incomplete.
- Creatinine levels are influenced by meat intake and muscle mass.
- Certain drugs, such as cimetidine, probenecid, and trimethoprim (which impede tubular secretion of creatinine), can affect creatinine levels.
Urea Clearance
Urea undergoes filtration in the glomeruli; however, approximately 40% of the filtered amount is reabsorbed by the tubules. The extent of reabsorption is contingent upon the rate of urine flow, leading to an underestimation of GFR. Urea's reliance on urine flow rate renders it less sensitive as an indicator of GFR.
When considered independently, Blood Urea Nitrogen (BUN) and serum creatinine lack sensitivity in detecting early renal impairment, as their values may register as normal. For instance, if the baseline value of serum creatinine is 0.5 mg/dl, a 50% reduction in kidney function would elevate it to 1.0 mg/dl. Therefore, clearance tests prove more beneficial in early-stage cases. In situations where biochemical tests yield normal results but renal function impairment is suspected, a creatinine clearance test becomes imperative. Conversely, if biochemical tests reveal abnormalities, clearance tests may be omitted.
What is the Difference Between GFR and eGFR?
GFR (Glomerular Filtration Rate) and eGFR (estimated Glomerular Filtration Rate) are both measures used to assess kidney function, but they have some differences. GFR is a direct measure of kidney function, while eGFR is an estimated value calculated using formulas based on serum creatinine and other factors. eGFR is more commonly used in clinical practice due to its convenience, but it's important to note that direct measurement of GFR is considered more accurate when feasible.
| Aspect | GFR (Glomerular Filtration Rate) | eGFR (estimated Glomerular Filtration Rate) |
|---|---|---|
| Defination | GFR is a measure of the volume of fluid that is filtered by the glomeruli per unit of time. It is considered the gold standard for assessing kidney function. | eGFR is an estimated value of the GFR, often calculated using mathematical formulas that take into account serum creatinine levels, age, gender, and sometimes race. |
| Measurement | GFR is usually measured directly through a clearance test, where a substance (such as inulin or creatinine) is introduced into the body, and its rate of clearance in the urine is measured. | eGFR is calculated using formulas based on serum creatinine levels, age, gender, and other factors. Commonly used formulas include the Modification of Diet in Renal Disease (MDRD) equation and the Chronic Kidney Disease Epidemiology Collaboration (CKD-EPI) equation. |
| Accuracy | Direct measurement of GFR is considered more accurate, but it may not be practical for routine clinical use. | eGFR is an estimation and may not be as accurate as direct measurement. However, it is widely used in clinical practice due to its convenience and cost-effectiveness. |
| Clinical Use | GFR is used to assess overall kidney function and is a crucial parameter in diagnosing and monitoring kidney diseases. | eGFR is a commonly used clinical parameter for assessing kidney function, especially in routine blood tests. It is often reported alongside serum creatinine levels. |
- Pathology
- Clinical Pathology
- Pathology Notes
- Notes
- Article
- How to
- Laboratory
- Laboratory Technique
- Laboratory Test Procedure
- Renal Function Test
- Creatinine Clearance Test
- Insulin Clearance Test
- Clearance of Radiolabeled Agents
- Cystatin C Clearance Test
- Urea Clearance
- Chemical Pathology
- Diseases and Disorders
Renal Biopsy: Indications, Contraindications, Complications and Procedure
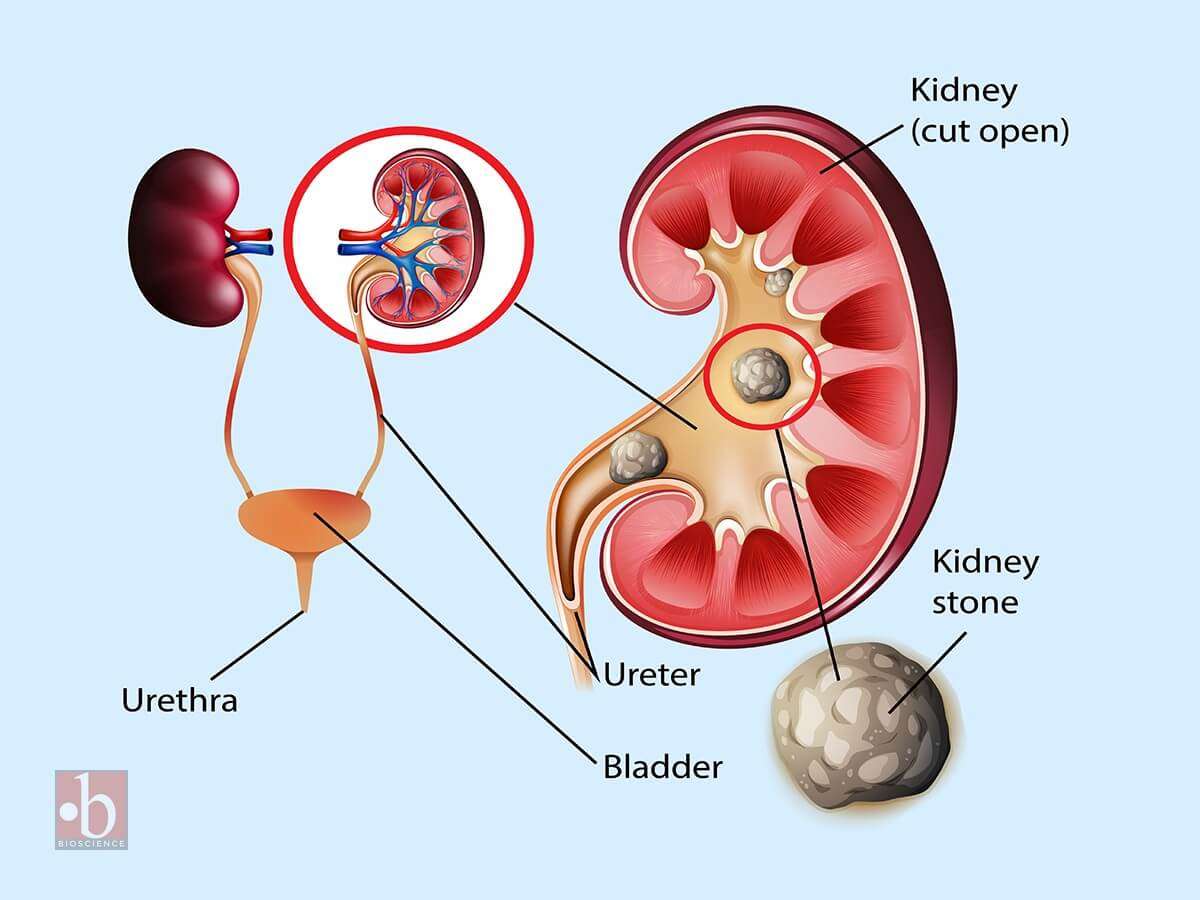
Renal biopsy (kidney biopsy) involves the extraction of a small kidney tissue sample for microscopic examination, with the first instance of percutaneous renal biopsy credited to Alwall in 1944.
For renal conditions, the utility of renal biopsy lies in:
- Establishing a precise diagnosis
- Assessing the severity and activity of the disease
- Evaluating prognosis by gauging the extent of scarring
- Planning treatment strategies and monitoring therapeutic responses
It is important to note that renal biopsy, while providing valuable diagnostic insights, carries inherent risks of procedure-related morbidity and, in rare instances, mortality. Therefore, a comprehensive assessment of the procedure's risks and the benefits derived from histologic examination should precede each renal biopsy.
Indications for Renal Biopsy
- Adults presenting with nephrotic syndrome (most prevalent indication)
- Children with nephrotic syndrome unresponsive to corticosteroid treatment.
- Acute nephritic syndrome requiring differential diagnosis
- Instances of unexplained renal insufficiency with kidney dimensions appearing nearly normal on ultrasonography
- Asymptomatic hematuria cases where other diagnostic tests fail to pinpoint the bleeding source
- Individuals with isolated non-nephrotic range proteinuria (1-3 gm/24 hours) accompanied by renal impairment
- Renal grafts displaying impaired function
- Kidney involvement in systemic diseases such as systemic lupus erythematosus or amyloidosis
Contraindications
- Uncontrolled severe hypertension
- Tendency toward hemorrhagic diathesis
- Presence of a solitary kidney
- Renal neoplasm cases (to prevent potential spread of malignant cells along the needle track)
- Presence of large and multiple renal cysts
- Kidneys displaying a small, shrunken morphology
- Active urinary tract infection, such as pyelonephritis
- Urinary tract obstruction
Complications
- Hemorrhage: Given the highly vascular nature of the renal cortex, a significant risk is the occurrence of bleeding, manifesting as hematuria or the formation of perinephric hematoma. Severe bleeding may occasionally require blood transfusion and, in rare cases, necessitate kidney removal.
- Arteriovenous fistula formation
- Infection
- Unintentional biopsy of another organ or perforation of a viscus (such as the liver, spleen, pancreas, adrenals, intestine, or gallbladder)
- Mortality (rare).
How is a Kidney Biopsy Done?
Kidney Biopsy Procedure
- Obtaining the patient's informed consent is a prerequisite.
- An ultrasound or CT scan is conducted to meticulously document the location and size of the kidneys.
- Blood pressure should be maintained below 160/90 mm Hg. Essential hematological parameters, including bleeding time, platelet count, prothrombin time, and activated partial thromboplastin time, should register within normal ranges. Blood samples are drawn for blood grouping and cross-matching, anticipating the potential need for blood transfusion.
- Prior to the procedure, the patient is appropriately sedated.
- The patient assumes a prone position, and the kidney is identified with ultrasound guidance.
- The skin over the selected site undergoes thorough disinfection, and a local anesthetic is administered.
- A small incision is made with a scalpel to accommodate the biopsy needle. Localization of the kidney is performed using a fine-bore 21 G lumbar puncture needle, with a local anesthetic infiltrated down to the renal capsule.
- Under ultrasound guidance, a tru-cut biopsy needle or spring-loaded biopsy gun is inserted and advanced to the lower pole. Typically, the biopsy is obtained from the lateral border of the lower pole. The patient is instructed to hold their breath in full inspiration during the biopsy. Once the biopsy is secured, and the needle is removed, normal breathing resumes.
- The biopsy specimen is placed in a saline drop and examined under a dissecting microscope to ensure adequacy.
- The patient is repositioned into the supine position, with continuous monitoring of vital signs and observation of urine appearance at regular intervals. Typically, patients are kept in the hospital for a 24-hour period.
The kidney biopsy process is segmented into three components for subsequent analysis: light microscopy, immunofluorescence, and electron microscopy. For light microscopy, renal biopsy specimens are routinely fixed in neutral buffered formaldehyde. Staining includes:
- Hematoxylin and eosin (for an overall assessment of kidney architecture and cellularity)
- Periodic acid-Schiff: To accentuate the basement membrane and connective tissue matrix.
- Congo red: Utilized for amyloid identification.
For electron microscopy, tissue fixation is achieved with glutaraldehyde. In immunohistochemistry, the presence of tissue deposits of IgG, IgA, IgM, C3, fibrin, and κ and λ light chains can be identified using specific antibodies. Many kidney diseases exhibit immune-complex mediation.
- Pathology
- Clinical Pathology
- Histopathology
- Biopsy
- Renal Biopsy
- Diseases and Disorders
- Laboratory
- Laboratory Technique
- Laboratory Test Procedure
- Renal Biopsy Indications
- Renal Biopsy Contraindications
- Renal Biopsy Complications
- Renal Biopsy Procedure
- Risks in Renal Biopsy Procedure
- Pathology Notes
- How to
- Article
- Notes
- Renal Function Test