Displaying items by tag: Blood Diseases and Disorders
Porphyrias: Laboratory Tests, Diagnosis and Treatment

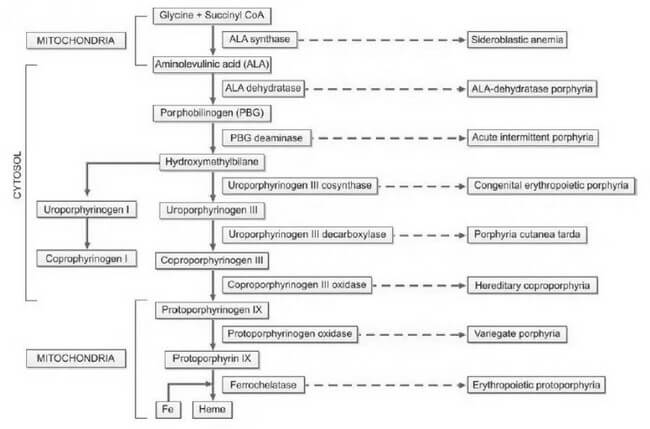
Porphyrias, derived from the Greek word "porphura," meaning purple pigment, encompass a diverse array of rare disorders arising from disruptions in the heme biosynthetic pathway. This disturbance leads to the abnormal accumulation of red and purple pigments known as porphyrins within the body. Heme, an integral component of hemoglobin, undergoes synthesis through a series of distinct steps, as illustrated in Figure 1. Each step is facilitated by a specific enzyme. In instances where any of these enzymatic processes falter due to hereditary or acquired causes, precursor molecules of heme, referred to as porphyrin intermediates, amass in the blood, deposit in the skin and various organs, and are excreted in urine and feces.
The categorization of porphyrias is contingent upon the location of the defect, resulting in different types with diverse clinical manifestations, severity levels, and the specific nature of accumulated porphyrin.
Historically, porphyria has been postulated as a potential explanation for medieval tales of vampires and werewolves. This conjecture arises from notable parallels between the behaviors exhibited by individuals afflicted with porphyria and the characteristics found in folklore. These similarities include light aversion, skin mutilation upon sunlight exposure, red teeth, psychiatric disturbances, and the consumption of blood to obtain heme.
Detection and accurate diagnosis of porphyrias pose significant challenges, often leading to oversight or misdiagnosis. Many porphyrias lack definitive physical findings, screening tests may produce false-negative results, diagnostic criteria are ambiguously defined, and mild disorders may yield enzyme assay results within the ostensibly 'normal' range.
Heme plays a crucial role in both bone marrow, where it is essential for hemoglobin synthesis, and the liver, where it is vital for cytochromes. Consequently, porphyrias are classified into erythropoietic and hepatic types based on the site of disease expression. Hepatic porphyrias predominantly impact the nervous system, while erythropoietic porphyrias primarily affect the skin. Furthermore, porphyrias are categorized as acute and nonacute (or cutaneous) types based on their clinical presentations, as outlined in Table 1. This systematic classification enhances our understanding of porphyrias, aiding clinicians, researchers, and medical professionals in comprehending the nuances of these complex disorders.
| Classification based on predominant clinical manifestations | Classification based on site of expression of disease | Classification based on mode of clinical presentation |
|---|---|---|
| Neuropsychiatric | Hepatic | Acute |
| Acute intermittent porphyria | ALA-dehydratase porphyria | ALA-dehydratase porphyria (Plumboporphyria) |
| ALA-dehydratase porphyria (Plumboporphyria) | Acute intermittent porphyria | Acute intermittent porphyria |
| Cutaneous (Photosensitivity) | Hereditary coproporphyria | Hereditary coproporphyria |
| Congenital erythropoietic porphyria | Variegate porphyria | Variegate porphyria |
| Porphyria cutanea tarda | Erythropoietic porphyria | Non-acute (cutaneous) |
| Erythropoietic protoporphyria | Congenital erythropoietic porphyria | Porphyria cutanea tarda |
| Mixed (Neuropsychiatric and cutaneous) | Erythropoietic protoporphyria | Congenital erythropoietic porphyria |
| Hereditary coproporphyria | Hepatic/Erythropoietic | Erythropoietic protoporphyria |
| Variegate porphyria | Porphyria cutanea tarda | - |
The inheritance patterns associated with porphyrias manifest as either autosomal dominant or recessive. The majority of acute porphyrias follow an autosomal dominant inheritance, signifying the transmission of a single abnormal gene copy. Consequently, the activity of the deficient enzyme is halved, resting at 50%. In instances where the hepatic heme level diminishes due to various factors, the activity of ALA synthase is spurred, resulting in an escalation of heme precursors up to the point of the enzyme defect. This surge in heme precursors precipitates the onset of symptoms characteristic of acute porphyria. Notably, as the heme level normalizes, the associated symptoms subside.
The accumulation of porphyrin precursors presents a noteworthy occurrence in lead poisoning, attributed to the inhibition of the enzyme aminolevulinic acid dehydratase within the heme biosynthetic pathway. This phenomenon can simulate the clinical presentation of acute intermittent porphyria.
Understanding the genetic underpinnings and enzymatic intricacies of porphyrias is crucial for clinicians, researchers, and medical professionals. The autosomal dominant inheritance pattern underscores the significance of a singular abnormal gene copy in the manifestation of acute porphyrias. Additionally, the intricate interplay between heme levels and enzymatic activity elucidates the nuanced triggers and resolution of acute porphyria symptoms. Moreover, the correlation between lead poisoning and the disruption of the heme biosynthetic pathway highlights the diagnostic challenges posed by conditions that mimic porphyric presentations, necessitating a keen clinical acumen for accurate differentiation.
Clinical Features
The clinical manifestations of porphyrias exhibit variability contingent upon the specific type of the disorder. Acute porphyrias, for instance, manifest with a spectrum of symptoms, including acute and intense abdominal pain, vomiting, constipation, chest pain, emotional and mental disturbances, seizures, hypertension, tachycardia, sensory deficits, and muscular weakness. This diverse array of clinical presentations underscores the complexity of acute porphyrias and the multisystemic impact they can exert.
In contrast, cutaneous porphyrias present a distinctive set of clinical features. Patients with cutaneous porphyrias commonly experience photosensitivity, characterized by the development of redness and blistering of the skin upon exposure to sunlight. Additional symptoms include itching, necrosis of the skin and gums, and an observable increase in hair growth over the temples. This distinctive clinical profile, outlined in Table 2, provides a comprehensive overview of the characteristic features associated with cutaneous porphyrias.
Understanding the nuanced clinical features associated with different types of porphyrias is pivotal for accurate diagnosis and effective management. The delineation of symptoms, ranging from abdominal pain and neurological manifestations in acute porphyrias to the distinctive photosensitivity and dermatological changes in cutaneous porphyrias, enhances the knowledge base for clinicians, researchers, and medical professionals. Such precision in characterizing the clinical landscape facilitates targeted interventions and improves patient outcomes.
| Porphyria | Deficient enzyme | Clinical features | Inheritance | Initial test |
|---|---|---|---|---|
| Acute intermittent porphyria (AIP)* | PBG deaminase | Acute neurovisceral attacks; triggering factors+ (e.g. drugs, diet restriction) | Autosomal dominant | Urinary PBG; urine becomes brown, red, or black on standing |
| Variegate porphyria | Protoporphyrinogen oxidase | Acute neurovisceral attacks + skin fragility, bullae | Autosomal dominant | Urinary PBG |
| Hereditary coproporphyria | Coproporphyrinogen oxidase | Acute neurovisceral attacks + skin fragility, bullae | Autosomal dominant | Urinary PBG |
| Congenital erythropoietic porphyria | Uroporphyrinogen cosynthase | Onset in infancy; skin fragility, bullae; extreme photosensitivity with mutilation; red teeth and urine (pink red urinestaining of diapers) | Autosomal recessive | Urinary/fecal total porphyrins; ultraviolet fluorescence of urine, feces, and bones |
| Porphyria cutanea tarda* | Uroporphyrinogen decarboxylase | Skin fragility, bullae | Autosomal dominant (some cases) | Urinary/fecal total porphyrins |
| Erythropoietic protoporphyria* | Ferrochelatase | Acute photosensitivity | Autosomal dominant | Free erythrocyte protoporphyrin |
| Disorders marked with * are the three most common porphyrias. PBG: Porphobilinogen |
The manifestation of symptoms in porphyrias is intricately linked to various triggers, encompassing pharmaceutical agents and lifestyle factors. Certain drugs, such as barbiturates, oral contraceptives, diazepam, phenytoin, carbamazepine, methyldopa, sulfonamides, chloramphenicol, and antihistamines, can serve as catalysts for symptoms. Emotional or physical stress, infections, dietary changes, fasting, substance abuse, premenstrual periods, smoking, and alcohol consumption also constitute potential triggers, amplifying the complexity of porphyria management.
Autosomal dominant porphyrias comprise a diverse group of disorders, including acute intermittent porphyria, variegate porphyria, porphyria cutanea tarda, erythropoietic protoporphyria (predominantly), and hereditary coproporphyria. In contrast, autosomal recessive porphyrias encompass congenital erythropoietic porphyria, erythropoietic protoporphyria (in a limited number of cases), and ALAdehydratase porphyria, also known as plumboporphyria.
Understanding the array of triggers and the genetic underpinnings of different porphyria types is pivotal for comprehensive patient care. The intricate interplay between pharmaceutical agents, lifestyle factors, and the distinct genetic characteristics of autosomal dominant and recessive porphyrias underscores the necessity for a nuanced approach in diagnosis and management. This multifaceted perspective equips medical professionals, and researchers with the knowledge required to navigate the complexities of porphyria, facilitating enhanced patient outcomes and advancing scientific understanding in the field.
Laboratory Diagnosis
The diagnosis of porphyria involves conducting tests on blood, urine, and feces, particularly during symptomatic periods. Achieving a timely and precise diagnosis is crucial for the effective management of porphyrias. Given the diverse and extensive clinical features associated with porphyrias, they are often considered in the differential diagnosis of various medical conditions. Most routine hospital laboratories are equipped to perform initial investigations when porphyria is suspected. However, for the identification of specific porphyria types, specialized laboratories with advanced testing capabilities become essential.
In the diagnostic process, blood, urine, and fecal analyses play a pivotal role, allowing for the detection of characteristic abnormalities during symptomatic phases. This comprehensive approach ensures a more accurate identification of porphyria subtypes, facilitating targeted and tailored therapeutic strategies.
Considering the intricate nature of porphyria diagnoses, collaboration with specialized laboratories becomes imperative. These facilities possess the advanced technologies and expertise required for in-depth analyses, enabling the discrimination between various porphyria types. This collaboration enhances the precision of the diagnostic process, contributing to improved patient outcomes and informed decision-making in the realm of porphyria management.
In essence, the diagnostic journey for porphyria demands a synergistic effort between routine hospital laboratories and specialized facilities, with a focus on leveraging advanced testing methodologies to unravel the complexities inherent in these conditions. This collaborative approach underscores the significance of accurate diagnostics in paving the way for effective porphyria management strategies.
Initial Studies
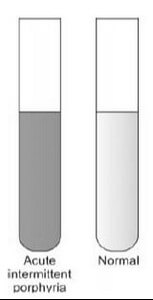
In the assessment of suspected acute porphyrias, specifically during acute neurovisceral attacks, it is imperative to submit a freshly collected, randomly obtained urine sample (10-20 ml) for the detection of heightened urinary excretion of porphobilinogen (PBG) (refer to Figure 2). Notably, in acute intermittent porphyria (AIP), the urine may exhibit a reddish or brown hue upon standing, as illustrated in Figure 3.
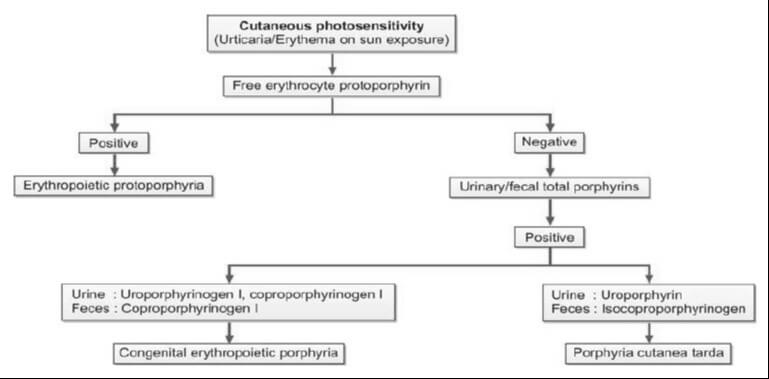
For cases where cutaneous porphyrias are suspected, with manifestations such as acute photosensitivity lacking skin fragility, a comprehensive diagnostic approach is warranted. This includes analyzing free erythrocyte protoporphyrin (FEP) in EDTA blood for the diagnosis of erythrocytic protoporphyria. Additionally, for all other cutaneous porphyrias characterized by skin fragility and bullae, an examination of fresh, random urine (10-20 ml) and either feces (5-10 g) or plasma is indispensable for identifying excess porphyrins. Detailed guidance on this diagnostic protocol is provided in Figure 4 and Table 2.
In essence, the diagnostic strategy for suspected porphyrias involves specific tests tailored to the clinical presentation. The utilization of various specimen types, including urine, blood, feces, and plasma, is crucial for the accurate identification of porphyrin abnormalities. The distinct visual cues, such as the color changes in urine associated with AIP, serve as valuable indicators in the diagnostic process. This meticulous and multifaceted approach ensures a comprehensive evaluation, facilitating precise diagnoses in the intricate landscape of porphyrias.
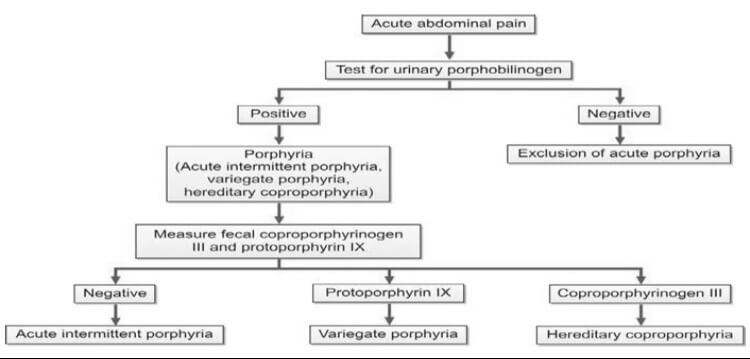
In addition to aiding in the diagnosis, the identification of specific heme intermediates excreted in urine or feces plays a pivotal role in pinpointing the site of defect in porphyria. Heme precursors, extending up to coproporphyrinogen III, exhibit water solubility, enabling their detection in urine. Conversely, protoporphyrinogen and protoporphyrin, being insoluble in water, are excreted through bile and can be identified in fecal samples. It is essential to shield all samples from light to preserve their integrity.
The requisite samples for a comprehensive porphyria assessment include a 10-20 ml fresh, random urine sample devoid of any preservatives, 5-10 g of wet fecal weight, and blood anticoagulated with EDTA. Each specimen type offers distinct insights into the porphyrin profile, contributing to a thorough evaluation of the disorder. The meticulous collection and analysis of these samples serve as critical steps in unraveling the intricacies of porphyria, ensuring a comprehensive understanding of the disorder's manifestations and facilitating targeted interventions.
In essence, the choice of sample type is guided by the solubility characteristics of specific heme intermediates, aligning with their excretion pathways. This systematic approach, coupled with stringent measures to protect samples from light-induced alterations, underscores the importance of precision and accuracy in the diagnostic process.
Test for Porphobilinogen in Urine
The Ehrlich’s aldehyde test serves as a diagnostic tool for detecting porphobilinogen (PBG) in urine. In this assay, Ehrlich’s reagent, composed of p-dimethylaminobenzaldehyde, reacts with PBG, resulting in the formation of a distinctive red color. The characteristic red product exhibits an absorption spectrum with a peak at 553 nm and a shoulder at 540 nm. It's noteworthy that both urobilinogen and porphobilinogen elicit a similar reaction, necessitating additional tests to discern between the two substances. To distinguish PBG from urobilinogen, solvent extraction can be employed, as outlined in the Watson-Schwartz test. This additional step is crucial for achieving specificity in the diagnostic process.
It is essential to recognize that levels of PBG might appear normal or near normal between attacks. Consequently, to mitigate the risk of false-negative results, it is imperative to conduct the test during an acute attack. This strategic timing ensures a more accurate and reliable assessment of PBG levels, contributing to a precise diagnosis and informed clinical decision-making.
Test for Total Porphyrins in Urine
The quantification of total porphyrins within an acidified urine sample is achievable through spectrophotometry, leveraging the distinct absorbance peak of porphyrins around 400 nm. This method allows for a semiquantitative estimation of porphyrin levels, providing valuable insights into the porphyrin profile present in the urine sample. Spectrophotometry, with its ability to measure the absorption of light at specific wavelengths, offers a precise and objective means of assessing the concentration of porphyrins in the given sample.
In this analytical approach, the intense absorbance peak observed around 400 nm serves as a reliable marker for the presence of porphyrins. This peak reflects the characteristic absorption spectrum of porphyrins, allowing for their identification and quantification in a systematic and accurate manner. The semiquantitative nature of the estimation enhances the diagnostic utility of the method, providing clinicians and researchers with valuable information regarding the porphyrin content in the urine.
The utilization of spectrophotometry in conjunction with acidified urine samples offers a robust technique for detecting and estimating total porphyrins. This method, marked by its precision and objectivity, contributes to the comprehensive assessment of porphyrin levels, facilitating diagnostic and research endeavors within the realm of porphyria evaluation.
Test for Total Porphyrins in Feces
The quantification of total porphyrins in fecal samples involves the use of spectrophotometry on an acidic extract of the specimen. However, a crucial preparatory step is required to eliminate interference from dietary chlorophyll, which also absorbs light around 400 nm. This interference is addressed through diethyl ether extraction, ensuring a more accurate and specific assessment of total porphyrin levels.
In the analytical process, an acidic extract of the fecal sample serves as the basis for spectrophotometric analysis. Spectrophotometry, with its ability to measure the absorption of light at specific wavelengths, allows for the precise determination of total porphyrins. The focus on an acidic environment facilitates optimal conditions for the assessment of porphyrin content.
To enhance the specificity of the analysis, the extraction of dietary chlorophyll using diethyl ether becomes imperative. This preparatory step is essential as chlorophyll absorbs light in a similar range as porphyrins, potentially leading to inaccurate measurements. By effectively removing this interference, the spectrophotometric analysis can provide more reliable and meaningful data regarding the concentration of total porphyrins in the fecal sample.
The process of determining total porphyrins in feces through spectrophotometry necessitates a meticulous approach, including the removal of dietary chlorophyll through diethyl ether extraction. This method ensures the accuracy and specificity of the analysis, contributing to the reliability of results in the evaluation of porphyrin levels in fecal samples.
Evaluation of Porphyrins in Erythrocytes and Plasma: Modern Techniques
Contemporary methodologies have supplanted traditional approaches such as visual examination for porphyrin fluorescence, as well as solvent fractionation and spectrophotometry. The advent of fluorometric methods represents a significant advancement in the analysis of porphyrins in erythrocytes and plasma.
Fluorometric techniques have emerged as the preferred means of assessing porphyrins, offering heightened precision and sensitivity compared to their predecessors. These methods leverage the unique fluorescence properties of porphyrins, providing a more refined and objective approach to their detection and quantification.
By utilizing fluorometry, researchers and medical professionals can achieve a clearer understanding of porphyrin levels in erythrocytes and plasma. This modernized approach enhances both the accuracy and efficiency of porphyrin testing, aligning with the evolving standards of scientific analysis in hematology and related fields.
This transition to fluorometric methods underscores the commitment to staying at the forefront of scientific advancements, ensuring that diagnostic and research practices remain not only rigorous but also in harmony with the latest technological innovations.
Comprehensive Assessment for Porphyria Diagnosis
Upon obtaining a positive result in the initial porphyria screening, a more in-depth analysis becomes imperative. This involves the quantification of porphyrin concentrations in urine, feces, and blood, a crucial step in establishing a precise and specific diagnosis. The tables below (Tables 3 and 4) provide detailed insights into the diagnostic criteria and reference values for this comprehensive evaluation.
By meticulously measuring porphyrin levels in these biological samples, healthcare professionals can discern the specific type and severity of porphyria, facilitating targeted and effective management strategies. This comprehensive approach not only confirms the presence of porphyria but also aids in tailoring treatment plans to the individual nuances of the patient's condition.
As with any diagnostic process, the accuracy and reliability of results depend on the proficiency of the laboratory techniques employed and the adherence to standardized protocols. This commitment to precision ensures that the gathered data is not only scientifically robust but also forms the cornerstone for informed clinical decisions and patient care.
| Porphyria | Urine | Feces |
|---|---|---|
| Acute intermittent porphyria | PBG, Copro III | – |
| Variegate porphyria | PBG, Copro III | Proto IX |
| Hereditary coproporphyria | PBG, Copro III | Copro III |
| PBG: Porphobilinogen; Copro III: Coproporphyrinogen III; Proto IX: Protoporphyrin IX. |
| Porphyria | Urine | Feces | Erythrocytes |
|---|---|---|---|
| Congenital erythropoietic porphyria | Uro I, Copro I | Copro I | – |
| Porphyria cutanea tarda | Uroporphyrin | Isocopro | – |
| Erythropoietic protoporphyria | – | – | Protoporphyrin |
| Uro I: Uroporphyrinogen I; Copro I: Coproporphyrinogen I; Isocopro: Isocoproporphyrinogen. |
Diagnostic Challenges in Latent Porphyrias and Remission Periods
During latent porphyrias and periods of remission, individuals may exhibit normal porphyrin levels, posing a diagnostic challenge. In such instances, a comprehensive approach involving enzymatic and DNA testing becomes imperative for an accurate diagnosis. These advanced testing methods delve into the genetic and enzymatic aspects, providing a more nuanced understanding of porphyria manifestation even in the absence of elevated porphyrin levels.
Upon confirming a diagnosis of porphyria, a critical next step involves the systematic examination of close family members for the presence of the disorder. This proactive approach is essential for early detection and intervention. Family members testing positive for porphyria should undergo counseling, equipping them with valuable insights into potential triggering factors and empowering them to make informed lifestyle choices that mitigate the risk of symptomatic episodes.
This meticulous diagnostic and familial investigation strategy not only aids in individual patient management but also contributes to the broader goal of familial health and well-being. By addressing latent cases and involving family members, healthcare professionals can establish a more comprehensive and effective framework for the understanding and management of porphyrias.
PLATELET GLYCOPROTEIN ANALYSIS
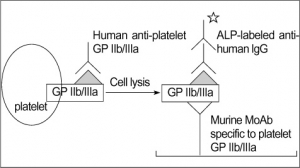
Fresh platelets should always be used. Storing platelets dramatically changes the level of transmembrane proteins. The best way is to follow one of standardized protocols defined in: Immunophenotypic analysis of platelets. Krueger LA, Barnard MR, Frelinger AL 3rd, Furman MI, Michelson AD.Curr Protoc Cytom. 2002 Feb;Chapter 6:Unit 6.10.
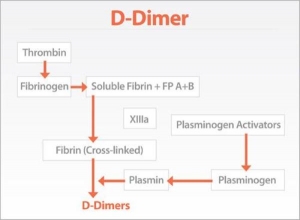
TEST FOR D-DIMER
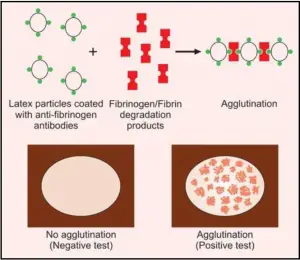
TEST FOR FIBRINOGEN/FIBRIN DEGRADATION PRODUCTS (FDPs)
Platelet Aggregation Studies

Platelet aggregation tests are carried out in specialized hematology laboratories if platelet dysfunction is suspected. These tests are usually indicated in patients presenting with the mucocutaneous type of bleeding and in whom screening tests reveal normal platelet count, prolonged bleeding time, normal prothrombin time, and normal activated partial thromboplastin time.
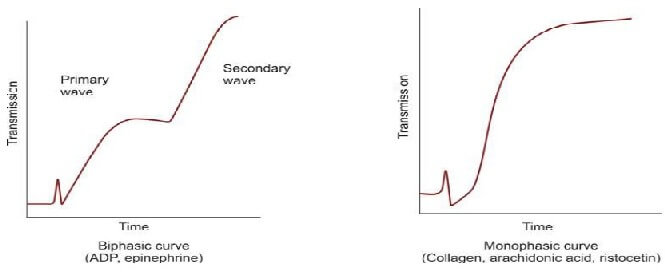
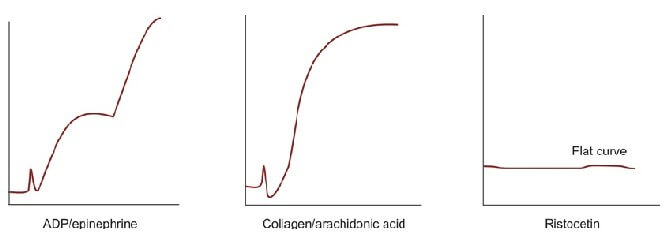
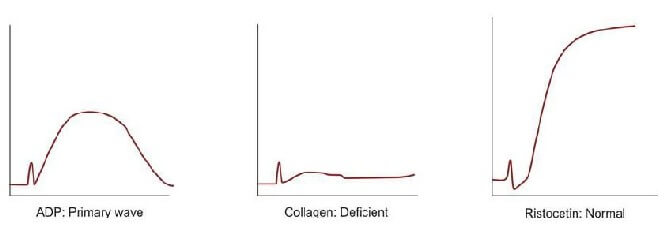
Platelet aggregation studies are carried out on platelet-rich plasma using an aggregometer. When a platelet aggregating agent is added to platelet-rich plasma, platelets form aggregates, and optical density falls (or light transmission increases); this is recorded by a chart recorder on a strip chart. Commonly used platelet aggregating agents are ADP (adenosine 5-diphosphate), epinephrine (adrenaline), collagen, arachidonic acid, and ristocetin. ADP (low dose) and epinephrine induce primary and secondary waves of aggregation (biphasic curve). The primary wave is due to the direct action of the aggregating agent on platelets. The secondary wave is due to thromboxane A2 synthesis and secretion from platelets. Collagen, arachidonic acid, and ristocetin induce a single wave of aggregation (monophasic curve) Normal aggregation curve is shown in Figure 804.1. Aggregation patterns in various platelet function defects are shown in Figures 804.2 to 804.4, and Table 804.1.

| Disorder | Platelet Aggregation pattern | Other features |
|---|---|---|
| Bernard Soulier syndrome | Normal with ADP, epinephrine, collagen, and arachidonic acid; deficient with ristocetin | Autosomal recessive; severe bleeding; giant platelets |
| Glanzmann's thrombasthenia | Deficient with ADP, epinephrine, collagen, and arachidonic acid; normal with ristocetin | Autosomal recessive; severe bleeding; small and discrete platelets; defective clot retraction |
| Storage pool defect | Primary wave with ADP and epinephrine, normal with arachidonic acid, deficient with collagen, normal with ristocetin | Defects of platelets granules; platelet dense granules are decreased with the deficient release of ADP, ATP, calcium, and serotonin |
| Aspirin-like defect | Primary wave with ADP and epinephrine, deficient with arachidonic acid, deficient with collagen, normal with ristocetin | - |
| von Willebrand disease | Normal with ADP, epinephrine, collagen, and arachidonic acid; deficient with ristocetin | Autosomal dominant/recessive; abnormality in aggregation corrected with cryoprecipitate |
MORPHOLOGY OF PLATELETS
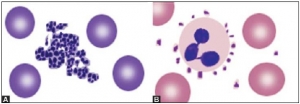
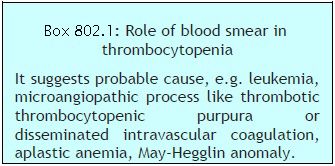 Platelets are small, 1-3 μm in diameter, purple structures with tiny irregular projections on surface. In blood films prepared from non-anticoagulated blood (i.e. direct fingerstick), they occur in clumps. If platelet count is done on automated blood cell counters using EDTA-anticoagulated blood sample, about 1% of persons show falsely low count due to the presence in them of EDTA dependent antiplatelet antibody. Examination of a parallel blood film is useful in avoiding the false diagnosis of thrombocytopenia in such cases. Occasionally, platelets show rosetting around neutrophils (platelet satellitism) (see Figure 802.1). This is seen in patients with platelet antibodies and in apparently normal persons. Blood smear examination can be helpful in determining underlying cause of thrombocytopenia such as leukemia, lymphoma, or microangiopathic hemolytic anemia (Box 802.1).
NUMERICAL ABNORMALITIES OF LEUKOCYTES
- Acute bacterial infections: Abscess, pneumonia, meningitis, septicemia, acute rheumatic fever, urinary tract infection.
- Tissue necrosis: Burns, injury, myocardial infarction.
- Acute blood loss
- Acute hemorrhage
- Myeloproliferative disorders
- Metabolic disorders: Uremia, acidosis, gout
- Poisoning
- Malignant tumors
- Physiologic causes: Exercise, labor, pregnancy, emotional stress.
- Severe bacterial infections, e.g. septicemia, pneumonia
- Severe hemorrhage
- Severe acute hemolysis
- Poisoning
- Burns
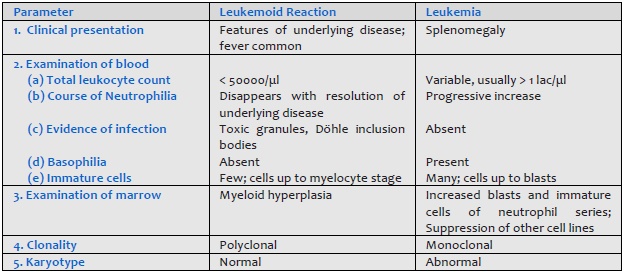
- Carcinoma metastatic to bone marrow Leukemoid reaction should be differentiated from chronic myeloid leukemia (Table 801.1).
- Infections
(a) Bacterial: typhoid, paratyphoid, miliary tuberculosis, septicemia
(b) Viral: influenza, measles, rubella, infectious mononucleosis, infective hepatitis.
(c) Protozoal: malaria, kala azar
(d) Overwhelming infection by any organism - Hematologic disorders: megaloblastic anemia, aplastic anemia, aleukemic leukemia, myelophthisis.
- Drugs:
(a) Idiosyncratic action: Analgesics, antibiotics, sulfonamides, phenothiazines, antithyroid drugs, anticonvulsants.
(b) Dose-related: Anticancer drugs - Ionizing radiation
- Congenital disorders: Kostman's syndrome, cyclic neutropenia, reticular dysgenesis.
- Neonatal isoimmune neutropaenia
- Systemic lupus erythematosus
- Felty's syndrome
- Hypersplenism
- Allergic diseases: Bronchial asthma, rhinitis, urticaria, drugs.
- Skin diseases: Eczema, pemphigus, dermatitis herpetiformis.
- Parasitic infection with tissue invasion: Filariasis, trichinosis, echinococcosis.
- Hematologic disorders: Chronic Myeloproliferative disorders, Hodgkin's disease, peripheral T cell lymphoma.
- Carcinoma with necrosis.
- Radiation therapy.
- Lung diseases: Loeffler's syndrome, tropical eosinophilia
- Hypereosinophilic syndrome.
- Infections: Tuberculosis, subacute bacterial endocarditis, malaria, kala azar.
- Recovery from neutropenia.
- Autoimmune disorders.
- Hematologic diseases: Myeloproliferative disorders, monocytic leukemia, Hodgkin's disease.
- Others: Chronic ulcerative colitis, Crohn's disease, sarcoidosis.
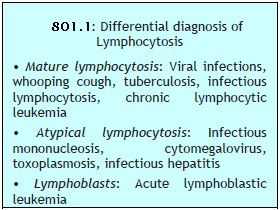 This is an increase in absolute lymphocyte count above upper limit of normal for age (4000/μl in adults, >7200/μl in adolescents, >9000/μl in children and infants) (Box 801.1).
- Infections:
(a) Viral: Acute infectious lymphocytosis, infective hepatitis, cytomegalovirus, mumps, rubella, varicella
(b) Bacterial: Pertussis, tuberculosis
(c) Protozoal: Toxoplasmosis - Hematological disorders: Acute lymphoblastic leukemia, chronic lymphocytic leukemia, multiple myeloma, lymphoma.
- Other: Serum sickness, post-vaccination, drug reactions.
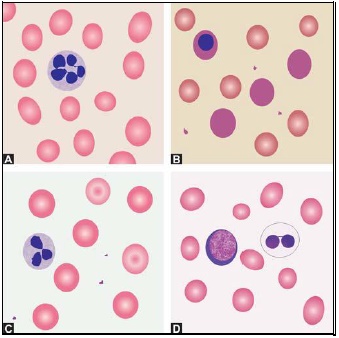
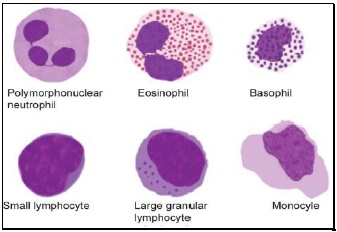
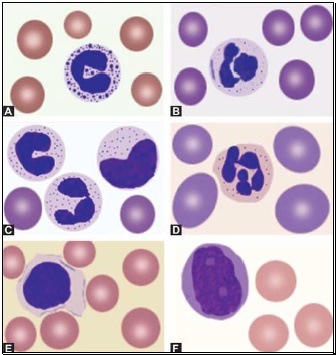
WHITE BLOOD CELLS MORPHOLOGY
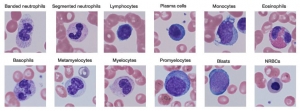
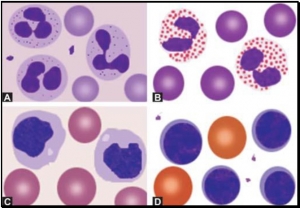
- Polymorphonuclear neutrophil: Neutrophil measures 14-15 μm in size. Its cytoplasm is colorless or lightly eosinophilic and contains multiple, small, fine, mauve granules. Nucleus has 2-5 lobes that are connected by fine chromatin strands. Nuclear chromatin is condensed and stains deep purple in color. A segmented neutrophil has at least 2 lobes connected by a chromatin strand. A band neutrophil shows non-segmented U-shaped nucleus of even width. Normally band neutrophils comprise less than 3% of all leukocytes. Majority of neutrophils have 3 lobes, while less than 5% have 5 lobes. In females, 2-3% of neutrophils show a small projection (called drumstick) on the nuclear lobe. It represents one inactivated X chromosome.
- Eosinophil: Eosinophils are slightly larger than neutrophils (15-16 μm). The nucleus is often bilobed and the cytoplasm is packed with numerous, large, bright orange-red granules. On blood smears, some of the eosinophils are often ruptured.
- Basophils: Basophils are seen rarely on normal smears. They are small (9-12 μm), round to oval cells, which contain very large, coarse, deep purple granules. It is difficult to make out the nucleus since granules cover it.
- Monocytes: Monocyte is the largest of the leukocytes (15-20 μm). It is irregular in shape, with oval or clefted (kidney-shaped) nucleus and fine, delicate chromatin. Cytoplasm is abundant, bluegray with ground glass appearance and often contains fine azurophil granules and vacuoles. After migration to the tissues from blood, they are called as macrophages.
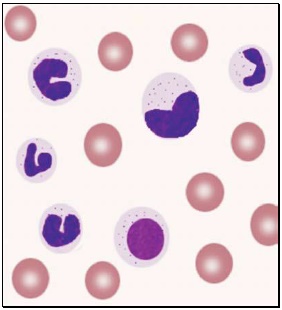
- Lymphocytes: On peripheral blood smear, two types of lymphocytes are distinguished: small and large. The majority of lymphocytes are small (7-8 μm). These cells have a high nuclearcytoplasmic ratio with a thin rim of deep blue cytoplasm. The nucleus is round or slightly clefted with coarsely clumped chromatin. Large lymphocytes (10-15 μm) have a more abundant, pale blue cytoplasm, which may contain a few azurophil granules. Nucleus is oval or round and often placed on one side of the cell.
 Toxic granules: These are darkly staining, bluepurple, coarse granules in the cytoplasm of neutrophils. They are commonly seen in severe bacterial infections.
- Döhle inclusion bodies: These are small, oval, pale blue cytoplasmic inclusions in the periphery of neutrophils. They represent remnants of ribosomes and rough endoplasmic reticulum. They are often associated with toxic granules and are seen in bacterial infections.
- Cytoplasmic vacuoles: Vacuoles in neutrophils are indicative of phagocytosis and are seen in bacterial infections.
- Shift to left of neutrophils: This refers to presence of immature cells of neutrophil series (band forms and metamyelocytes) in peripheral blood and occurs in infections and inflammatory disorders.
- Hypersegmented neutrophils: Hypersegmentation of neutrophils is said to be present when >5% of neutrophils have 5 or more lobes. They are large in size and are also called as macropolycytes. They are seen in folate or vitamin B12 deficiency and represent one of the earliest signs.
- Pelger-Huet cells: In Pelger-Huet anomaly (a benign autosomal dominant condition), there is failure of nuclear segmentation of granulocytes so that nuclei are rod-like, round, or have two segments. Such granulocytes are also observed in myeloproliferative disorders (pseudo-Pelger-Huet cells).
- Atypical lymphocytes: These are seen in viral infections, especially infectious mononucleosis. Atypical lymphocytes are large, irregularly shaped lymphocytes with abundant cytoplasm and irregular nuclei. Cytoplasm shows deep basophilia at the edges and scalloping of borders. Nuclear chromatin is less dense and occasional nucleolus may be present.
- Blast cells: These are most premature of the leukocytes. They are large (15-25 μm), round to oval cells, with high nuclear cytoplasmic ratio. Nucleus shows one or more nucleoli and nuclear chromatin is immature. These cells are seen in severe infections, infiltrative disorders, and leukemia. In leukemia and lymphoma, blood smear suggests the diagnosis or differential diagnosis and helps in ordering further tests (see Figure 800.2 and Box 800.1).
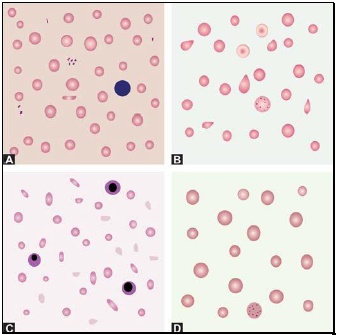
RED CELLS MORPHOLOGY
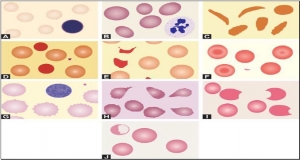
 Red cells are best examined in an area where they are just touching one another (towards the tail of the film). Normal red cells are 7-8 μm in size, round with smooth contours, and stain deep pink at the periphery and paler in the center. Area of central pallor is about 1/3rd the diameter of the red cell. Size of a normal red cell corresponds roughly with the size of the nucleus of a small lymphocyte. Normal red cells are described as normocytic (of normal size) and normochromic (with normal staining intensity i.e. hemoglobin content).
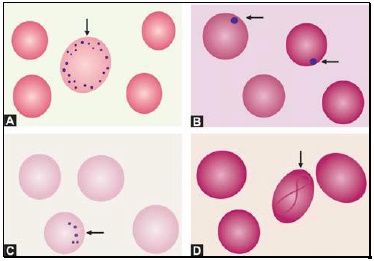
- Red cells with abnormal size (see Figure 799.1)
- Red cells with abnormal staining
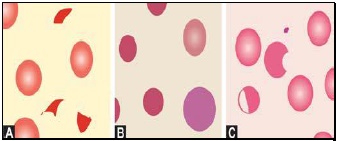
- Red cells with abnormal shape (see Figure 799.1)
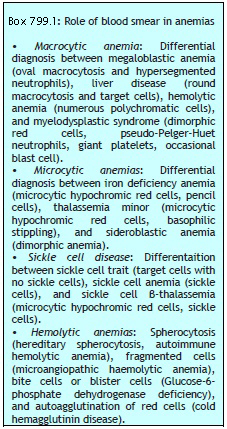
- Red cell inclusions (see Figure 799.2)
- Immature red cells (see Figure799.3)
- Abnormal red cell arrangement(see Figure 799.4).
Macrocytes are red cells larger in size than normal. Oval macrocytes (macro-ovalocytes) are seen in megaloblastic anemia, myelodysplastic syndrome, and in patients being treated with cancer chemotherapy. Round macrocytes are seen in liver disease, alcoholism, and hypothyroidism.
Staining intensity of red cells depends on hemoglobin content. Red cells with increased area of central pallor (i.e. containing less hemoglobin) are called as hypochromic. They are seen when hemoglobin synthesis is defective, i.e. in iron deficiency, thalassemias, anaemia of chronic disease, and sideroblastic anemia.
Basophilic stippling or punctate basophilia refers to the presence of numerous, irregular basophilic (purple-blue) granules which are uniformly distributed in the red cell. These granules represent aggregates of ribosomes. Their presence is indicative of impaired erythropoiesis and they are seen in thalassemias, megaloblastic anemia, heavy metal poisoning (e.g. lead), and liver disease.cell. These granules represent aggregates of ribosomes. Their presence is indicative of impaired erythropoiesis and they are seen in thalassemias, megaloblastic anemia, heavy metal poisoning (e.g. lead), and liver disease.
Pappenheimer bodies are basophilic, small, ironcontaining granules in red cells. They give positive Perl's Prussian blue reaction. Unlike basophilic stippling, Pappenheimer bodies are few in number and are not distributed throughout the red cell. They are seen following splenectomy and in thalassemias and sideroblastic anemia.
Cabot's rings are fine, reddish-purple or red, ring-like structures. They appear like loops or figure of eight structures. They indicate impaired erythropoiesis and are seen in megaloblastic anemia and lead poisoning.
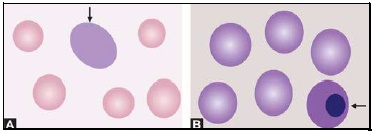
Autoagglutination refers to the clumping of red cells in large, irregular groups on blood smear. It is seen in cold agglutinin disease. Role of blood smear in anemia is shown in Box 799.1 and Figures 799.5 to 799.7.